In recent blog posts, we’ve looked at the pivot table Count function, the Average function, and the Min and Max functions. In this article we’ll look at the Product function.
Product Summary Function
The Product summary function shows the result of multiplying all the underlying values in the Values area. The result is the same as using the PRODUCT function on the worksheet to calculate the multiplied values.
In all the years that I’ve worked with pivot tables, I’ve never had to use the Product summary function, and can’t imagine a situation where it would be useful. However, you can see how it works, and decide if it would be useful in any of your applications.
PRODUCT Worksheet Function
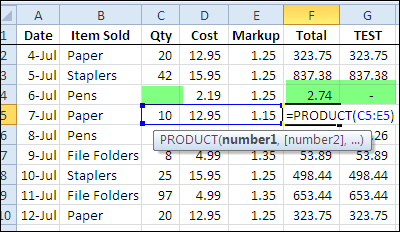
The PRODUCT worksheet function can be useful as a quick way to multiply several values in a worksheet row. For example, in this list of orders, the PRODUCT function multiplies the item quantity, times the cost, times the markup rate, to get the total price for each order.
In column G, you can see the total calculated by using the multiplier operator instead. The only case in which the results are different is where there is a blank cell, such as in row 4. The PRODUCT function treats the blank as a 1, and the multiplier operator treats the blank as a zero.

In this scenario, the PRODUCT worksheet function shows a meaningful result.
PRODUCT Worksheet Function for Columns
However, when you’re using data as the source for a pivot table, you aren’t multiplying rows, as you would with the PRODUCT worksheet example above. The pivot table will summarize the data from several, or even thousands of rows, so the PRODUCT function isn’t useful, in my experience.
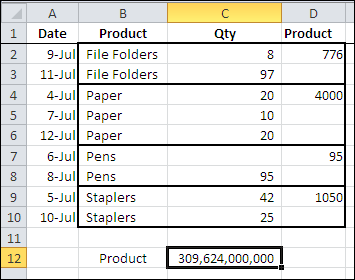
In the screen shot below, you can see the pivot table source data, with the product calculated for each type of item that’s sold, using the PRODUCT worksheet function. Instead of multiplying the values in rows, values in the same column (Qty) are being multiplied.
At the bottom of the source data is the overall PRODUCT calculation.

Unlike the previous example, these products are meaningless.
Pivot Table Product Summary Function
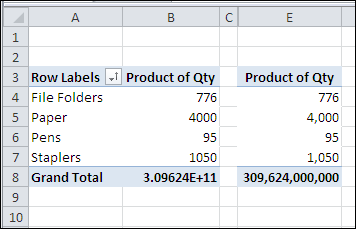
When you use the Product summary function in a pivot table that’s based on the data source shown above, the results are the same meaningless numbers.
The results of the Product function may be very large numbers and default to a Scientific number format. You can format the numbers as Number format, instead of Scientific format.
Note: Excel only stores and calculates with 15 significant digits of precision, so after the 15th character you’ll only see zeros.

_________

I’m surprised that there isn’t more emphasis on the difference between the Product function and standard multiplication with the asterisk. I’ve reviewed several sites that discuss the function and this is the first site I’ve seen that even acknowledges the difference. The Product function treats a blank cell as a “1” while standard multiplication treats it as a “0”. The difference could have disasterous results if used incorrectly on a million dollar proposal. The two are not equivalent and should not be discussed as though they are.
“The pivot table will summarize the data from several, or even thousands of rows, so the PRODUCT function isn’t useful, in my experience.”
The product summary makes perfect sense for geometric progressions.
Like stock returns listed % vertically by date.
The product summary makes perfect sense where suming values makes it into nonsense.
I didn’t see in this demo how to actually use the product function even if it isn’t generally useful. I used it to transpose my data (since I’m no expert in dealing with that stuff) and since I didn’t actually multiply the data by anything (I couldn’t figure out how even if I wanted to), it assumes “1” and keeps my real/original data value (which I want, but still am curious that if I had to multiply my data by correction or weighting factors or something, I still don’t see how to in the pivot table environment directly; of course I realize I can in the spreadsheet). I’m not sure where another person understood that it assumes an empty cell should be “1” (could be that Excel corrected this in more recent versions) – it kept it blank in my exercise…