Sorting a Pivot Field With Hidden Items

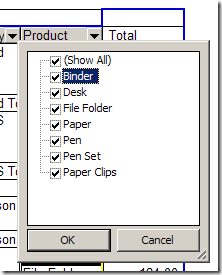
A common problem in an Excel pivot table is that new items are added at the end of a drop down list. For example, in the following list, the Paper Clips item is at the end of the list, instead of appearing in alphabetical order.
ListOrder01

This problem can be solved by sorting the field as described in my previous article – New Items at End of Pivot Table Drop Down Lists.

Error Message For Hidden Items

Usually, sorting the list quickly solves the problem, but I recently had an email from Martin tePoele, who had received an error message while trying to sort a field in his pivot table.

The message said: “Too many items are hidden. Unhide some items to continue.”

Pivot table too many items hidden

The field that Martin was trying to sort had over a thousand items, and only about 40 were selected. All the rest were hidden.

Limits in Excel 2003

I did some testing in Excel 2003, and discovered that 512 items seems to be the limit. If more than 512 items are hidden, you’ll get the error message when you try to manually sort the field.

However, I was able to programmatically sort the field, with 1000+ items hidden, without any problems. You could try this if you have more that 512 items hidden, and you don’t want to unhide them in order to sort the pivot field.

For example, the following code will sort all the pivot fields in ascending order.

‘==========================

Sub PivotSort()
Dim pt As PivotTable
Dim pf As PivotField
Set pt = ActiveSheet.PivotTables(1)

    For Each pf In pt.PivotFields
        pf.AutoSort xlAscending, pf.Name
    Next pf

End Sub

‘==========================

Hidden Items in Excel 2007

With the increased limits to pivot tables in Excel 2007, the problem seems to be fixed. I was able to hide 1000+ items in a pivot field, and could manually sort the field without getting the error message.

_____________________


Separate Pivot Table Field Items with a Blank Row

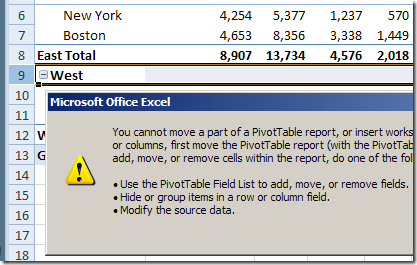
To make the pivot table easier to read, you might like each item in a pivot table field to be followed by a blank row. You can’t insert the rows manually, because Excel will display an error message if you try that method.

PTRowInsertError

However, in any of the pivot table report layouts, you can format the outer row fields, so each item has a blank row after it.

Note: All the outer row fields will be affected by this setting – you can’t limit it to one or more selected fields.

Add a Blank Row in Report Layout

  1. Select a cell in the pivot table, and on the Ribbon, click the Design tab.
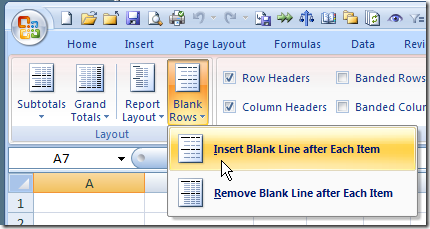
  2. In the Layout group, click Blank Rows, and then click Insert Blank Line After Each Item.

InsertBlank

Format the Row

To highlight the blank rows, you can manually add a fill color:

  1. Click at the left of one of the blank rows, to select all the blanks for that field.
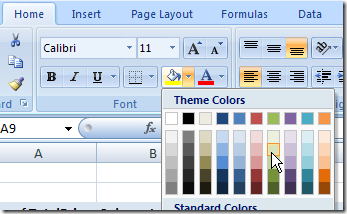
  2. On the Ribbon’s Home tab, click the drop down arrow for Fill Color.
  3. Click on the color you’d like in the blank rows.

RibbonFillColor

Please visit my Contextures web site, for more pivot table formatting tips.

_________________

Turning Off Pivot Table Subtotals in Excel 2003

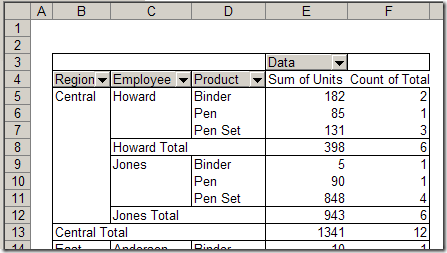
When you add multiple fields to the row or column area, the outer fields automatically get subtotals. For example, in this pivot table, Region and Employee are the outer fields, and a Total row was added for each item.

PTSubtotals

Sometimes these subtotals are useful, but in other pivot tables you might want to stop them from appearing.

Manually Turn Off the Subtotals

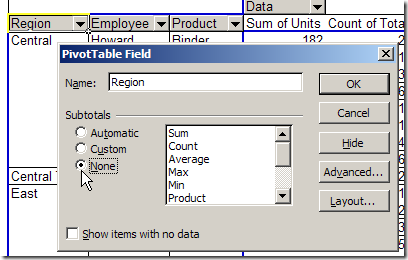
Unfortunately, here’s no setting you can change to stop the subtotals from automatically appearing for outer row and column fields. However, you can manually turn them off after they appear:

1. Double-click the field button.

2. For Subtotals, select None, then click OK.

PTSubtotalsNone

Programmatically Turn Off the Subtotals

If you frequently turn off the subtotals, you might find it easier to use a macro to do the work for you. You can create your own code, or purchase my Pivot Power Premium add-in

It has commands to show or hide the Row, Column, or all Subtotals in a pivot table.

_______________________

Refreshing All Pivot Tables in a Workbook

If there are several pivot tables in your workbook, you might want to refresh all of them at the same time instead of refreshing each pivot table individually.

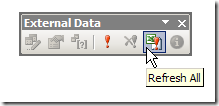
To refresh all the pivot tables in the active workbook at the same time, display the External Data toolbar, and click the Refresh All button.

RefreshAllButton

Note: Using the Refresh All command will also refresh all external data ranges in the active workbook, and affects both visible and hidden worksheets.

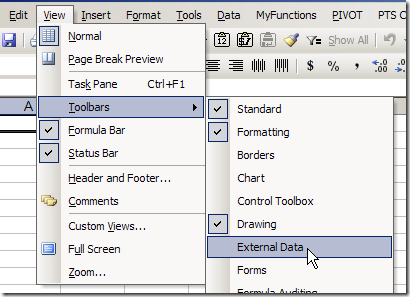
Display the External Data Toolbar

  1. Click the View menu
  2. Click Toolbars, then click External Data

ExternalDataToolbar

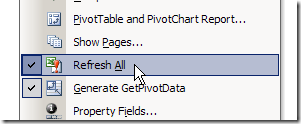
Add the Refresh All Button to the PivotTable Toolbar

Instead of displaying the External Data toolbar, you can add the Refresh All button to the PivotTable toolbar:

  1. Select a cell in a pivot table, then click the Toolbar Options arrow at the end of the PivotTable toolbar.
  2. Click Add or Remove ButtonsAddRemoveBtns
  3. Click Pivot Table.AddRemovePT
  4. Click Refresh All to select it (a checkmark will appear beside each selected button).AddRemoveRefreshAll
  5. Click outside the list to close it.
    ___________________________

    For more information on pivot tables, see the Pivot Table Topics on my Contextures web site.

    ___________________________

New Items at End of Pivot Table Drop Down Lists

While working in the pivot table source data, you might add new items. For example, if you start selling a new product, that product will appear in the list of orders. If your pivot table is based on that list of orders, the new product will also appear in the pivot table, when you refresh it.

Sometimes the new items appear at the end of the drop down lists, instead of in alphabetical order. In this list you can see that Paper Clips are at the end, but should follow Paper.

ListOrder01

To fix this problem, you can sort the field where the new items appear. In this example the new items are in the Product field, so we’ll sort that field.

Sort the List in Excel 2007

  1. In the pivot table, click the dropdown arrow for Row Labels.
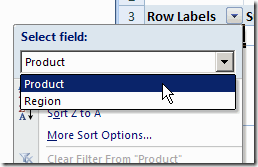
  2. If there are two or more fields in the Row Labels area, click the drop down arrow at the top of the menu, and select the field that you want to sort. (The Select Field drop down doesn’t appear if only one field is in the Row Labels area)
    ListOrderB01
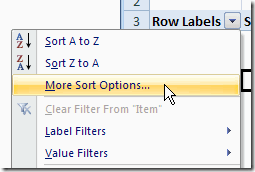
  3. Click on More Sort Options…
    ListOrderB02
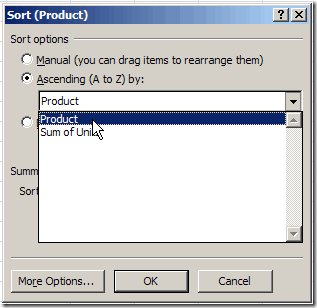
  4. In the Sort dialog box, under Sort Options, click Ascending (A to Z), and select the field name from the drop down list.
    ListOrderB03
  5. Click OK, to close the dialog box.

Sort the List in Excel 2003

To fix this problem, you can sort the field where the new items appear. In this example the new items are in the Product field, so we’ll sort that field.

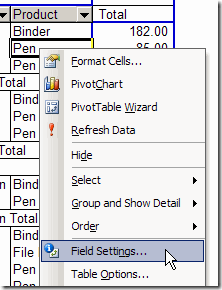
  1. In the pivot table, right-click on any item in the field that you want to sort.
  2. In the pop-up menu that appears, click on Field Settings

    ListOrder02

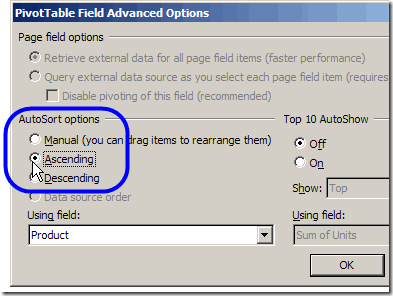
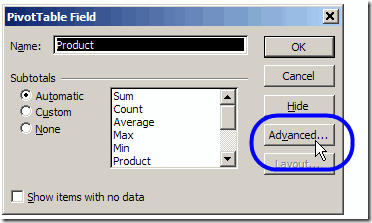
  3. In the PivotTable Field dialog box, click the Advanced buttonListOrder03
  4. Under AutoSort Options, click AscendingListOrder05
  5. Click OK, to close the dialog boxes.

_____________________
 

Create a Combination Pivot Chart

After you create a column chart from a pivot table, you might want to change it so the chart is a combination chart type. You’d like most of the series to remain as columns, and one of the series to be a line.

In Excel 2007 there are no Combination Chart types that you can choose, as there were in the Excel 2003 Chart Wizard. However, in any version of Excel you can create your own combination charts.

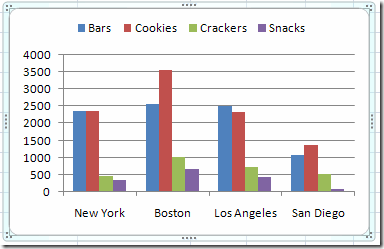
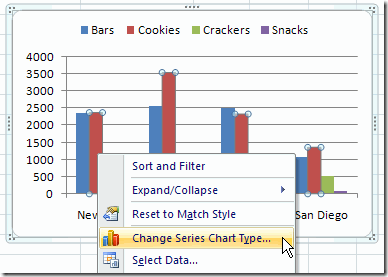
In this example, the chart is a Clustered Column chart type, with the series showing the sales of each category in each city.

ComboChart01

You’d like to change the Cookies series to a line, so it stands out from the other categories.

In the pivot chart, right-click on one of the Cookies columns.

In the shortcut menu that appears, click Change Series Chart Type

ComboChart02

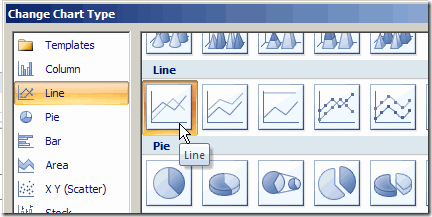
In the Change Chart Type dialog box, click the Line chart type, and click one of the Line subtypes, then click OK.

ComboChart03

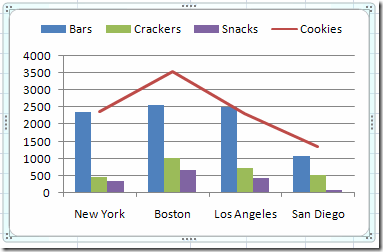
The chart is now a combination chart, with columns for Bars, Crackers and Snacks, and a line for Cookies.

ComboChart04

    ___________________________
    For more information on pivot tables, see the Pivot Table Topics on my Contextures web site.

    ___________________________
Create a List of Pivot Table Formulas

If you’ve used calculated items and calculated fields in your pivot table, you can automatically create a list of all the formulas.

List the Formulas in Excel 2007

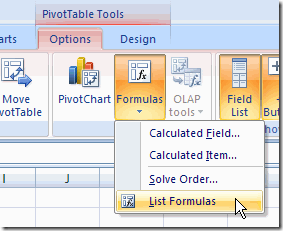
  1. Select any cell in the pivot table.
  2. On the Ribbon, under the PivotTable Tools tab, click the Options tab.
  3. In the Tools group, click Formulas
  4. Click  List Formulas.

PivotFormList01

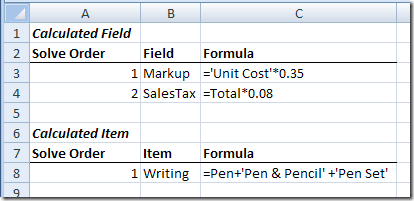
A new sheet is inserted in the workbook, with a list of the calculated fields and a list of the calculated items.

PivotFormList02

List the Formulas in Excel 2003

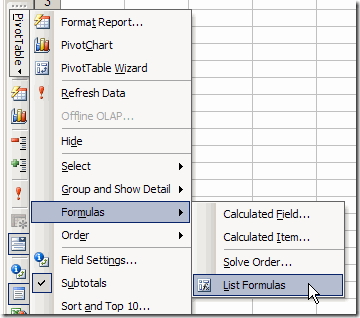
  1. Select any cell in the pivot table.
  2. On the Pivot toolbar, click PivotTable.
  3. Click Formulas, then click  List Formulas.

PivotFormList03

A new sheet is inserted in the workbook, with a list of the calculated fields and calculated items (see the Excel 2007 example above).

    ___________________________
    For more information on pivot tables, see the Pivot Tables on my Contextures web site.

    ___________________________
Filter the Source Data For a Pivot Table

To see the detail behind a number in a pivot table, you can double-click a data cell in the pivot table. This creates a new worksheet, with the related records from the source data. This technique can be helpful when troubleshooting, but you can end up with many extra sheets in your workbook, and you’ll need to delete all the excess sheets.

Continue reading “Filter the Source Data For a Pivot Table”