Grouped and Ungrouped Dates from Same Pivot Table Source

In some workbooks, you might create two or more pivot tables that are based source data. Even if they are on different worksheets, those pivot tables will share some features, such as calculated items and grouped fields.
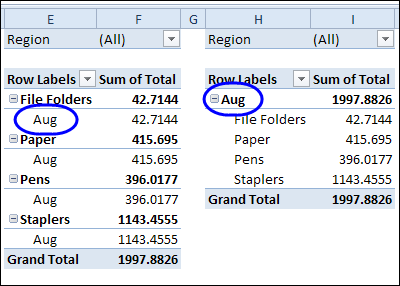
pivotcacheshared01 

So, if you group the dates in one pivot table, the same grouping will show up in the other pivot table. This occurs because the pivot tables share the same pivot cache. You can manually create a separate pivot cache, by copying one of the pivot tables to a different workbook, temporarily. See the instructions here.

Note: If you create a separate pivot cache for one of the pivot tables, the file size might increase substantially. To reduce the effect, you can turn off the option to save the source data with the file.
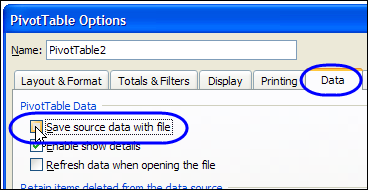
pivottableoptionssavedataoff 

Create New Pivot Cache with VBA

Instead of manually creating a separate pivot cache for a pivot table, you can select a cell in the pivot table, and run the following code.

It adds a temporary sheet to the workbook, and creates a new pivot table there, based on the same data source, but in a new pivot cache. The selected pivot table is set to the same pivot cache as the new table, and then the temporary sheet is deleted.

Sub SelPTNewCache()
    Dim wsTemp As Worksheet
    Dim pt As PivotTable
    
    On Error Resume Next
    Set pt = ActiveCell.PivotTable
    
    If pt Is Nothing Then
        MsgBox "Active cell is not in a pivot table"
    Else
        Set wsTemp = Worksheets.Add
        
        ActiveWorkbook.PivotCaches.Create( _
            SourceType:=xlDatabase, _
            SourceData:=pt.SourceData).CreatePivotTable _
            TableDestination:=wsTemp.Range("A3"), _
            TableName:="PivotTableTemp"
        
        pt.CacheIndex = wsTemp.PivotTables(1).CacheIndex
        
        Application.DisplayAlerts = False
        wsTemp.Delete
        Application.DisplayAlerts = True
    End If
    
exitHandler:
        Set pt = Nothing

End Sub

_____________________

Format Pivot Table Labels Based on Date Range

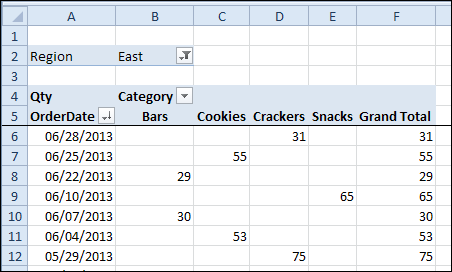
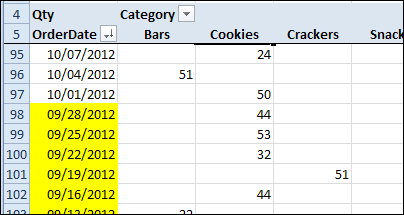
In a pivot table that contains a long list of dates, you can use conditional formatting to highlight a specific date range. In this example, the pivot table contains forecast data for 2.5 years, with dates in the OrderDate field.

pivotcondformatdates01

When the file opens, we’re usually interested in checking the forecast amounts for the upcoming month. It can take a bit of time and concentration to find those dates in the long list. We’ll highlight the labels in yellow, so they stand out, and are easy to find.

We’ll use dynamic conditional formatting (Next Month), so the highlighting will change each month when we open the workbook.

Highlight the Upcoming Month

Follow these steps to highlight Row Labels where the order forecast date is in the upcoming month. It’s currently August, so the September dates will be highlighted.

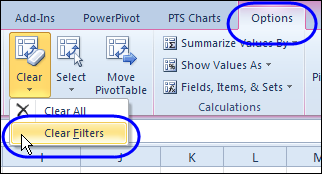
  1. In the pivot table, remove any filters that have been applied – all the rows need to be visible before you apply the conditional formatting.
    • pivotclearfilters
  2. Select all the dates in the Row Labels that you want to format.
  3. On the Ribbon, click the Home tab, and then in the Styles group, click Conditional Formatting.
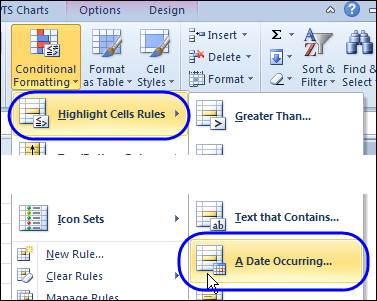
  4. In the list of conditional formatting options, click Highlight Cells Rules, and then click A Date Occurring.
    • pivotcondformatdates02
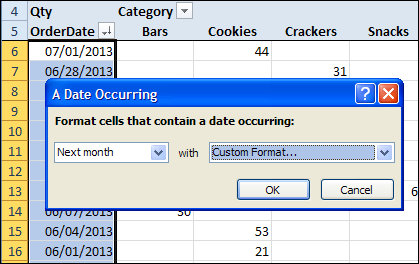
  5. In the date range drop-down, select Next Month, and then click the arrow to open the formatting drop-down list.
  6. Select one of the formatting options, or create a Custom Format. I selected Custom Format, and used a yellow fill colour.
    • pivotcondformatdates03
  7. Click OK to close the A Date Occurring dialog box.

The dates from the upcoming month are highlighted, and will stand out in the report when you open the workbook.

 pivotcondformatdates04

Conditional Formatting Warnings

This pivot table’s source data won’t change, because we don’t alter the forecast after it has be finalized.

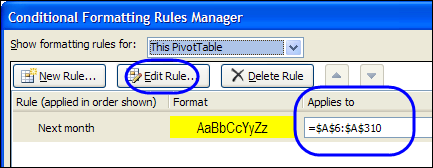
  • However, if you apply conditional formatting to a pivot table, and new data is added, it might not be included in the formatted area. Be sure to check the range, in the Manage Rules box for Conditional Formatting, and edit the rule, if necessary.
  • Also, if you change the location of the date field, the conditional formatting will not automatically move with that field. You will have to modify the conditional formatting rule, to point to the new location.

pivotcondformatdates05

___________________________-

Change Pivot Table Report Filters With VBA

With Report Filters at the top of your pivot table, you can select specific items from a field, and narrow the scope of your report.

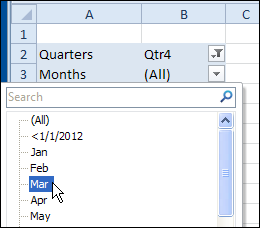
In the pivot table shown below, the order date field has been grouped, and Quarters and Months are in the Report Filter area.

reportfilterchangevba

Change Report Filters Automatically

I’ve previously posted sample code for changing one (or all) pivot table’s report filters, based on changes in another pivot table. In one of my Contextures Blog posts, Ian asked if we could change one report filter in a pivot table, based on another report filter in the same pivot table.

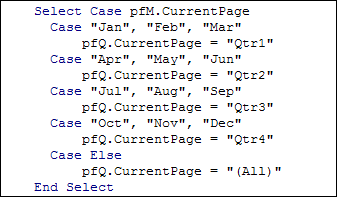
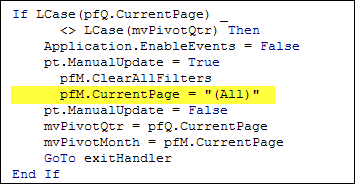
That sounded like an interesting challenge, so I’ve created code that changes the Quarters filter, when a month is selected. For example, if you select May, it will change to Qtr2. If your fiscal year is different, you could change the quarters in the code.

reportfilterchangevba02

If you select a different Quarter, the Months filter will automatically change to "(All)". Then, if you want a specific month within that quarter, you could select it.

reportfilterchangevba03

Download the Sample File

To download the sample file, please visit the Pivot Tables VBA – Report Filters page on the Contextures website. The file is in Excel 2007/2010 format, zipped, and contains macros. Enable macros when you open the file, if you want to test the code.

In the file, to see the code, right-click on the pivot table sheet tab, and click View Code.

__________________

Add Calculated Items in an Excel Pivot Table

When you add fields to a pivot table, you can show or hide that field’s pivot items. In addition to the existing items, you can create calculated items for a pivot field.

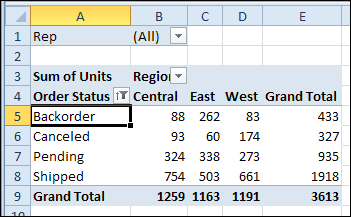
In the screen shot below, the Order Status field has 4 items – Backorder, Canceled, Pending and Shipped.

calculateditem06

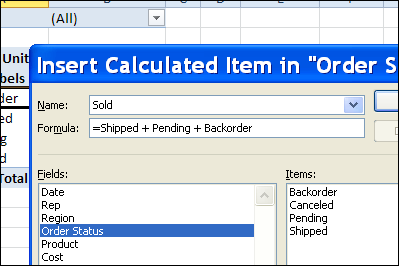
To combine the amounts for Backorder, Pending and Shipped, you could create a calculated item – Sold.

calculateditem02

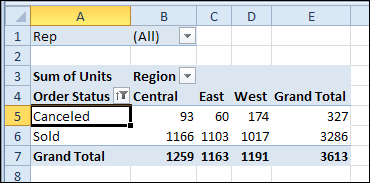
Then, hide the other items, and just show Canceled and Sold in the pivot table, under the Order Status field.

calculateditem07

Watch the Video

To see the steps for creating a calculated item, and displaying it in the pivot table, please watch this short video tutorial. You’ll also hear the disadvantages to using calculated items.

Download the Sample File

To see the written instructions, and to download the sample file, please visit the Excel Pivot Table Calculated Item page on my Contextures website.

____________________

Remove Old Items from Excel 2010 Pivot Table Drop Downs

After you create an Excel 2010 pivot table, the source data may change.  New items might be added, and old items are sometimes removed from the data.

In this example, the East and Central regions are merged, and the Central region name is replaced by “East” in all the source data records.

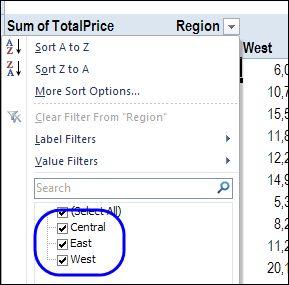
After changing the data, if you refresh the pivot table, the Central region data disappears, but its name is still in the Region drop down.

pivottableolditems01

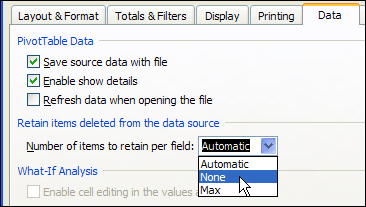
To fix the problem, you can change the Retain Items setting in the pivot table options, to clear old data from the pivot table drop downs.

pivottableolditems02

Watch the Video

To see the steps for preventing old items from appearing in the pivot table, please watch this short video tutorial. These instructions apply to both Excel 2010 and Excel 2007.

__________________________

Filter All Pivot Tables for Specific Fields Only

On my Contextures website, there are a few sample files that let you filter one pivot table, and automatically change all the other pivot tables. You can find them on the Sample Files page, in the Pivot Table section.

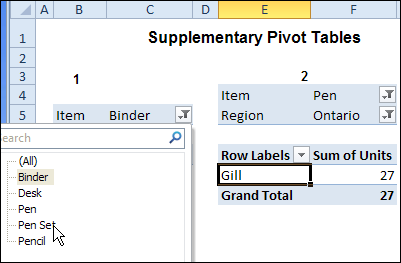
For example, in the worksheet shown below, if you select Pen Set as the Item in pivot table 1, the same item will be selected in pivot table 2.

pivotfiltermultilist02

This works with Excel VBA Event code, that runs automatically when either pivot table is updated.

Limit the Filter Fields

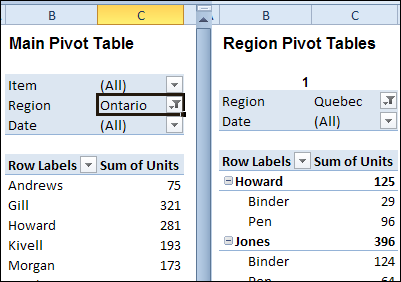
This code works well, if you want to change all of the fields in all of the workbook’s pivot tables. However, you might have a different worksheet for each Region’s pivot table. If someone changes a Region on one sheet, you don’t want it to automatically change all the other sheets.

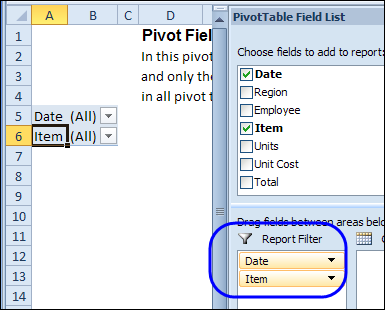
In the latest version of the Change Multiple Pivot Tables Automatically workbook, I’ve added a sheet where you can select the specific fields that you want to include. In the screen shot shown below, the Master List pivot table only has Date and Item in its Report Filter area.

pivotfiltermultilist01

Change the Filter

With the revised code, if you filter one of the pivot tables for Region, only that pivot table will be affected, because Region is not in the master list. If you filter for Item or Date, all the pivot tables in the workbook will be updated with the selected item.

In the screen shot below, Region is being changed in the worksheet at the left. The change will not affect the worksheet on the right. However, if the Date is filtered in either pivot table, it will automatically update the other pivot tables in the workbook.

pivotfiltermultilist03

Download the Sample File

To see the code and test the macro, please visit the Excel Sample Files page, and go to the Pivot Tables section. Look for PT0028 – Change Specific Page Fields with Multiple Selection Settings, and download the zipped file.

The file is in Excel 2007/2010 format, and it contains macros. Be sure to enable macros if you want to test the code.

__________________

Change Excel Pivot Table Subtotal Text

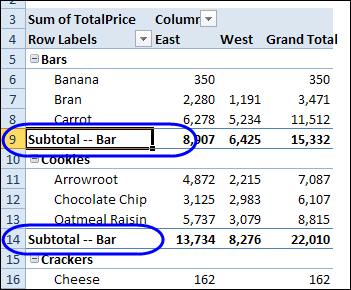
When you add two or more fields to the Row area in a pivot table, the outer fields will automatically display subtotals. By default, the subtotal row has a label that stars with the item name, followed by "Total"

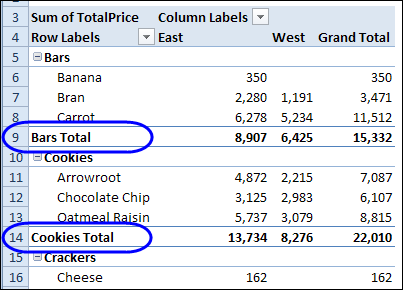
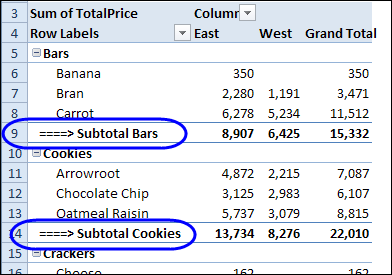
In the pivot table shown below, the Category and Product fields are in the Row Labels area, and there is a subtotal for each item in the outer field – Category. You can see the Bars Total and Cookies Total labels.

pivotsubtotaltext01

Instead of leaving the default subtotal labels, you type a new label in any subtotal row. The text that you enter will apply to all the subtotals in that field.

Type a New Subtotal Label

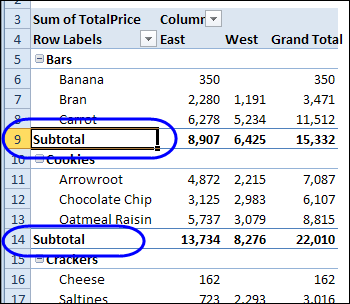
When you type a new subtotal label, you can include the item name, or omit it. For example, if you select the Bars Total label in cell A9, and type "Subtotal", all of the items will change to that label. There is no item name in any subtotal label.

pivotsubtotaltext02

Include the Item Name

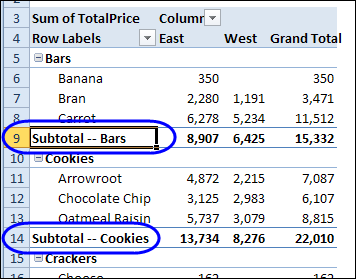
If you include the item name, such as Subtotal – Bars, when typing the new text, each subtotal will include its own item name.

pivotsubtotaltext03

When you type the item name, be sure to type it exactly as it appears in the pivot table. If you misspell the item name, such as "Bar" instead of "Bars", that word will be included in all the other subtotal labels.

pivotsubtotaltext04

Text Before and After Item Name

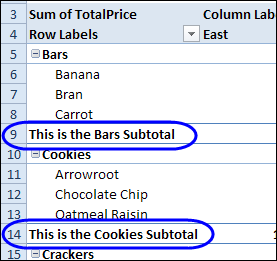
You can add text before and/or after the item name in the subtotal label. In the next example, the Bars subtotal label was changed to, "This is the Bars Subtotal". The other products show the same text before and after their item names.

pivotsubtotaltext07 

Get Creative with Subtotals

In addition to text, you can use other characters in the subtotal labels. In the example below, I typed a couple of space characters, then equal signs and a greater than symbol, to create an arrow.

pivotsubtotaltext05 

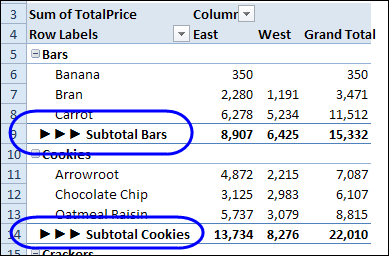
In the next example, I pressed the Alt key, and typed 16 on the numeric keypad, to create a right-pointing triangle. That certainly draws attention to the subtotals!

pivotsubtotaltext06 

NOTE: If you’re using a keyboard that doesn’t have a separate numeric keypad, you might have to press the Fn key, and the Alt key, then type 16 on the numbers that appear on the JKL keys.

So, you can get creative with those subtotal labels. Just remember that they can’t be changed individually – a change to one will be applied to all of them.

_____________________
Arrange Pivot Table Data Vertically

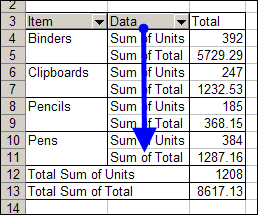
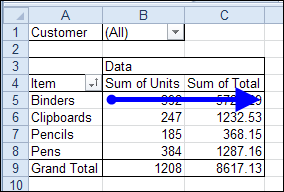
In Excel 2003, and earlier versions, when you added multiple data fields to a pivot table, they were automatically arranged vertically. The data headings showed up in the Row area, stacked one on top of the other.

piv04a

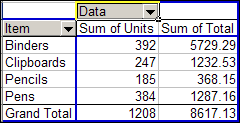
If you wanted the data headings arranged horizontally, you could drag the data button in the Column area.

Here is the same pivot table, with horizontal data headings.

piv05

Vertical Data in Excel 2010 Pivot Table

Pivot tables changed quite a bit in Excel 2007, and the default layout for multiple data fields is now horizontal. Using the same data, this is the default layout in Excel 2010.

pivotdatavertical01

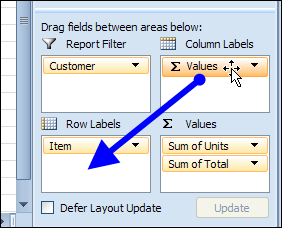
If you want to change the data to a vertical layout, you can drag the Values button in the Pivot Table Field List, from the Column Labels area to the Row Labels area.

pivotdatavertical02

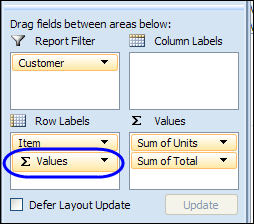
Usually, the Values button would be positioned below the other fields in the Row Labels area.

pivotdatavertical03

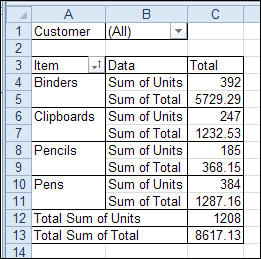
After you move the Values label, the data fields will be rearranged, and they will show vertically, with headings in the Row Labels area.

pivotdatavertical04

Watch the Excel 2010 Data Layout Video

To see the steps for rearranging the data in Excel 2010, please watch this short video tutorial.

_____________

Pivot Table Grand Totals at Top

When you create an Excel pivot table, the grand totals are automatically added at the bottom, and at the right. With the Grand Total command on the Excel Ribbon, you can show or hide the grand totals, but you can’t move them.

The good news is that there is a quick and easy workaround for this problem, which allows you to show the column grand total at the top.

There are written instructions on my Contextures website, on the Pivot Table Grand Totals page, where you can also download a sample file for this technique.

Watch the Grand Totals Video

To see the steps for the grand total workaround, please watch this short video.

__________________
Create Multiple Copies of Excel Pivot Table

In an Excel pivot table, you can put fields in the Report Filter area, like the City and YrMth fields in the pivot table shown below.

image

If you need to print a report for a specific city, you can select that city’s name from the drop down list.

image

Create a Pivot Table for Each City

If you want to print a copy of the pivot table for each city in the drop down list, it might take a while to do the task manually. Instead, you can use a built-in pivot table feature, to automatically create a separate pivot table for each city. Each pivot table will be on its own worksheet, and will have all the formatting that you applied to the original pivot table.

To create a pivot table for each item in a pivot table’s Report Filter:

  1. In the City filter, select "(All)", or select specific cities from the list. If a city is not selected, a pivot table copy will not be created for it.
  2. Select a cell in the pivot table, and on the Excel Ribbon, under the PivotTable Tools tab, click
    the Options tab.
  3. At the left end of the Ribbon, click the drop down arrow for Options.
  4. Click Show Report Filter Pages
    •  image
  5. In the Show Report Filter Pages dialog box, click on City, to select that field.
    • image
  6. Click OK, to create the pivot table pages.

A worksheet is created for each city, with the city’s name on the sheet tab. On each worksheet
is a copy of the original pivot table, with the city’s name selected in the Report Type filter.

image

Print the City Pivot Tables

After you create the City pivot table pages, you can select all the City worksheets, and print them.

Then, while the City sheets are still selected, delete them, so only the original pivot table is left in the workbook.

image

More Pivot Table Tips

Please visit the Contextures website for more Excel pivot table tips and tutorials.

________________________