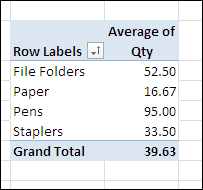
When you add a numeric data field to the Values area in a pivot table, the summary function defaults to either Sum or Count. You can change that field to use one of the other summary functions, such as Average.
The Average Function
The Average function in a pivot table works like the AVERAGE function on the worksheet to calculate the average (mean) of the values. It totals all the underlying values in the Values area, and divides by the number of values.

You can use the Average function to compare amounts, such as order sizes, student grades, and project times, across a large number of instances.
Blanks and Zeros
Just as they are on the worksheet, blank cells are ignored when calculating the pivot table averages, but zero cells are included.
In the data source shown below, cell C7 is blank. That blank cell is not included in either the worksheet average (C12),

or in the pivot table average, shown below.

Hidden Zeros
If you have formatted the worksheet to hide zero values, remember that those zero values will be included in the averages, even if the cells appear blank.
In the two data sources shown below, the overall average is different. Zeros are hidden on the worksheet, and cell F7 contains a zero. Cell C7 is blank.

If you create pivot tables from these two data sources, the pivot table Average function would include the hidden zeros, just as the worksheet Average does.
Format the Results
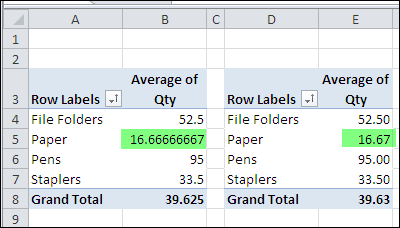
When you use the Average summary function, the results will probably show a strange mixture of decimal places, as shown in the pivot table at the left, in the screen shot below.

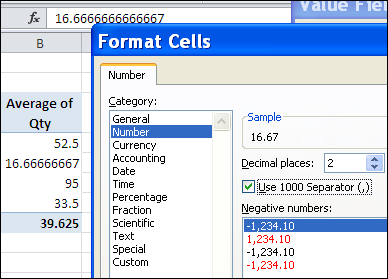
Format the field to have a consistent number of decimal places (as in the pivot table at the right, above), so the numbers are easy to compare.

____________

Are there any suggestions as to why this does not work on the pivot table? It does work in the worksheet but when I use the average in the pivot table, it takes the blanks (I have also tried null) as 0 and throws off my average. Office 2013.
@BeckyJo, it sounds like Excel is seeing something in those cells, even though they look blank.
Can you select all the blank cells in the source data, then press Delete to clear them out?
Then refresh the pivot table, and see if the results change.