Distinct Count in Excel Pivot Table

When you create a pivot table to summarize data, Excel automatically creates sums and counts for the fields that you add to the Values area. In addition, you might want to see a distinct count (unique count) for some fields, such as:

  • The number of distinct salespeople who made sales in each region
  • The count of unique products that were sold in each store

Continue reading “Distinct Count in Excel Pivot Table”

Give Your Excel Pivot Table a Makeover

When you create a pivot table, do you just slap it together, and hope for the best, or do you spend time experimenting with different calculations, layouts and field arrangements?

Yes, it’s easy to fall into a rut, and create the same type of pivot table, each time that you build one. That makes it quick and easy to get the job done, but you might not be presenting the data in the best way possible.

It’s time to give your pivot table a makeover, so it looks better, and its data is easier to read and understand.

Continue reading “Give Your Excel Pivot Table a Makeover”

Create Calculated Field With a Count

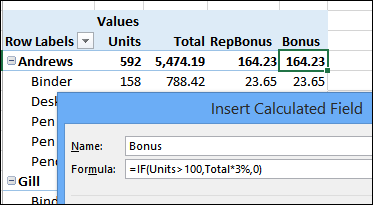
In addition to using fields from the source data, you can create calculated fields in a pivot table, to add your own formulas. For example, add a field that multiplies the total sales by 3%, to show a Bonus amount.

You can learn the basics of Calculated Fields on my Contextures website.

pivotcalculatedfield00

Continue reading “Create Calculated Field With a Count”

Create a Calculated Field in a Pivot Table

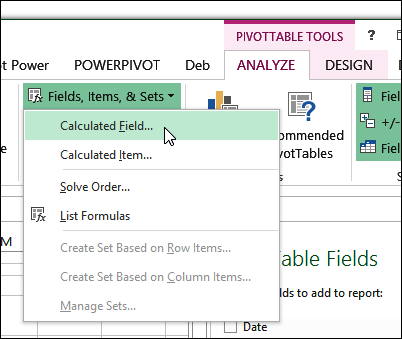
One of the top pivot table fears in our survey was “How do you insert a calculated field?” And no wonder it was near the top of the list – pivot table formulas can be very confusing!

So, let’s take a look at calculated fields, and its close companion, the calculated item.

Continue reading “Create a Calculated Field in a Pivot Table”

Hide Zero Items in Pivot Table

If you create a calculated item, extra items might appear in the pivot table, with zero amounts in some rows. In the example shown below, a calculated item was created in the Category field. Because of that, all the cities are listed under each region, instead of just the region in which they are located.

Los Angeles and San Diego are not in the East, so their sales in that region show up as zero. It makes the pivot table look messy and confusing!

Continue reading “Hide Zero Items in Pivot Table”

Calculated Field vs Calculated Item

After you create a pivot table, you can enhance the results by writing your own formulas, to create calculated fields and calculated items. e When you’re getting started with formulas, it might not be clear what the difference is. When should you use a calculated field and when should you create a calculated item?

calculateditemfield06

We’ll take a look at a pivot table that uses both types of formulas, and see where and how they work. You can also find more information on each type of formula on my Contextures website:

Continue reading “Calculated Field vs Calculated Item”

Accidentally Create Calculated Items

In a pivot table, you can create calculated fields and calculated items, by inserting following a few steps, to insert formulas. There are detailed instructions on my web site

But did you know that you can accidentally create a calculated item too, without going through all the usual steps?

Continue reading “Accidentally Create Calculated Items”

Show Percent Difference in Pivot Table Amounts

With one of the built-in custom calculations in a pivot table, you can quickly show the percent difference between two amounts. In this example, forecast amounts have been entered for each product, for each month. When they become available, the actual amounts are entered in the workbook.

Continue reading “Show Percent Difference in Pivot Table Amounts”