After you build an Excel pivot table, you might see a few row labels or column labels that contain the text “(blank)”.
This happens when data is missing from the source data. For example, in the source data, you might have a few sales orders that don’t have a Store number entered.
Video: Fix Pivot Table Headings
Watch this short video to see how to fix those “(blank)” labels, and there are written steps below the video.
- NOTE: The video also shows how to remove “Sum of” from the headings in the Values area, and there are written steps on my Contextures site.
Video Timeline:
- 0:00 Create Pivot Table
- 0:33 Remove “Sum of” in Headings
- 2:01 Fix Blank Label Cells
Labels Show (Blank)
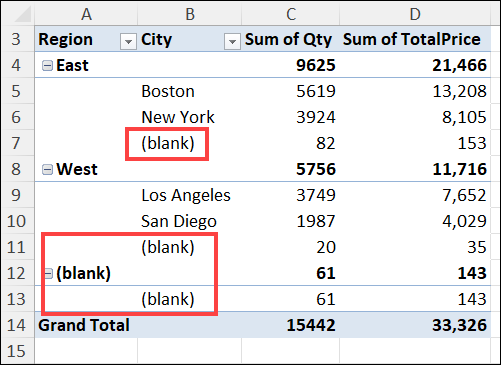
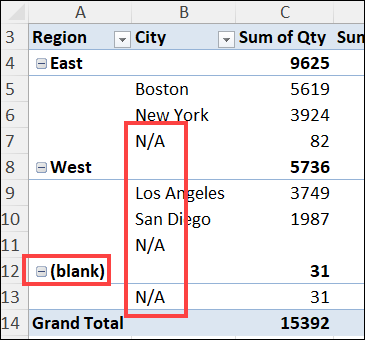
In the pivot table shown below, there are three City heading cells, in column B, that shows (blank), instead of a city name. There is also one Region heading cell in column A that has the same problem.
When working with a pivot table, I find that text distracting, and usually remove it, to get a cleaner look in the pivot table.
- Sometimes I replace the “(blank)” with other text, such as “N/A”
- In most cases, I want the cell to look blank, so I replace it with a space character
The steps to do that are below this screen shot.
Pivot Option Setting Does NOT Change Labels
First, here’s a solution that you might have tried, to remove the “(blank)” text, and found that it didn’t do what you needed.
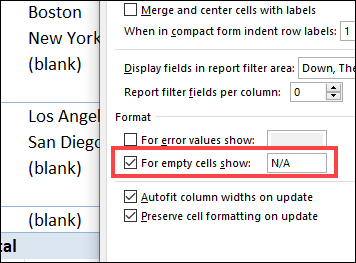
- In the PivotTable Options dialog box, on the Layout & Format tab, there is a setting, “for empty cells show:”
- Maybe you typed “N/A” in that box, or a space character, hoping it would solve the “(blank)” label problem
- After making that change in the Options window, you clicked the OK button.
Why That Does NOT Work
After the PivotTable Options dialog box closed, you’d be disappointed to see that the “(blank)” headings were still in the row labels.
That solution does not work for “(blank)” cells, because: that “empty cells” setting has these limitations:
- it only affects cells in the Values area
- it does NOT affect the Row or Column Labels areas.
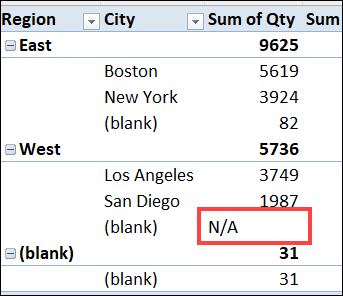
For example, in the screen shot below, you can see that:
- missing data in the Values area has been replace by N/A
- row labels and column labels haven’t changed – they still show “(blank)”.
Manually Change Blank Labels
Instead of using the PivotTable Options, you can manually change the (blank) labels in the Row or Column Labels areas by typing over them in the pivot table.
However, this technique has a couple of limitations too:
- You cannot type an existing item name, to replace the (Blank) entry
- If you type an existing name, the (blank) label will move into the place where that item was in the pivot table layout
- You cannot clear the cell and leave it empty – it must have a text entry
How to Change Label Text
Here are the steps for manually changing a pivot table row label text, or heading labels in the column areas.
- Note: I used “N/A” in this example, but you could use a different text string, or a space character.
To change a blank label cell to “N/A”, follow these editing steps:
- First, select one of the Row or Column Labels that contains the text (blank)
- Even if there are multiple cells with a “(blank)” label, you only need to select one of them.
- You DO NOT need to press Ctrl and select all of them
- Next, on your keyboard, type N/A in the cell, and then press the Enter key.
Pivot Table Changes
After you press the Enter key, you’ll see the following changes in the pivot table, shown in the screen shot below:
- All other (Blank) items in that same pivot field will change to display the same text
- In this example, all “(blank)” cells in the City column have changed to “N/A”.
- Blank items in other pivot fields are NOT affected
- In this example, the “(blank)” cell in the Region column has NOT changed to “N/A”.
Pivot Table Sample Data
To get Excel data for practice with your pivot table skills, go to the Excel Sample data page on my Contextures website.
- For the example in this page, I used the Food Sales Data, and cleared a few cells in the source data.
- There are several other sample files to download, such as Workplace Safety, Insurance Policy Sales, and Stationery Sales.
___________________________
More Pivot Table Tips
For more information on pivot tables, see these pages on my Contextures site:
Clear Old Items in Pivot Table
__________________________
Fix Pivot Table Row Heading Cells Blank Label
____________________

