Starting Each Pivot Item on a New Page

Normally, a long pivot table prints to the bottom of a page, then continues on the next page. The page break occurs naturally, not at a specific position in the pivot table.

You can control the page breaks, by changing the pivot table settings.

The Sample Layout

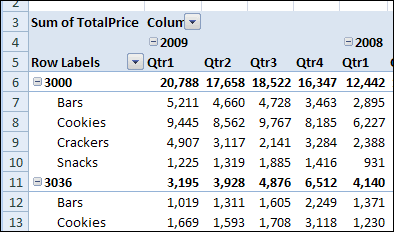
In this example, the pivot table has two fields in the Row Labels area – Store and Product Category.

pivotitempage01

We’d like to print this pivot table, with each store’s data starting on a new page. That way, we’d be able to print the entire
report, and send each store its own section.

Change the Field Setting

We’ll change a setting in the Store field, so each pivot item starts on a new page in the printed report.

  1. Right-click one of the Store labels in the pivot table, and then click Field Settings.
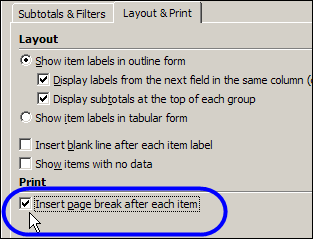
  2. In the Field Settings dialog box, on the Layout & Print tab, add a check mark to Insert Page Break After Each Item.
  3. Click OK, to close the dialog box.

PivotItemPage02

Things to Consider

The Insert Page Break After Each Item setting doesn’t force all items for a field fit on one page. It only creates a page break so the next item will start on a new page. If a field has many items, it might print on two or more pages.

Also, with this setting, your printed report could use an excessive amount of paper. You might prefer to manually adjust the page breaks in Page Break Preview.

To Go To Page Break Preview

  1. On the Ribbon’s View tab, in the Workbook Views group, click Page Break Preview.

    RibbonPageBreak

  2. Dashed lines indicate an automatic page break and solid lines are manual page breaks.
  3. To move a page break, point to it, and drag up or down on the page.

To return to Normal view

  1. On the Ribbon’s View tab, in the Workbook Views group, click Page Break Preview.

_____________

Pivot Table Defaults to Sum or Count

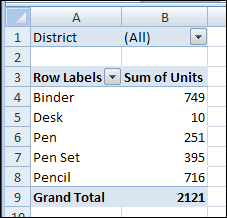
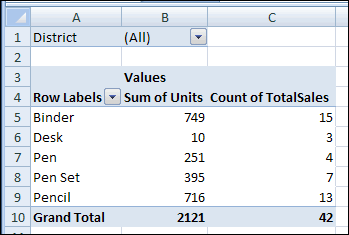
When you add a numeric field to the Values area of a pivot table, it usually appears as a Sum. For example, in the pivot table shown below, the Units field became Sum of Units.

ValueSum

Occasionally, when you add a numeric field to the Values area, it shows the Count, instead of the Sum. In the same pivot table, when the TotalSales field is added, it shows a Count.

ValueCount

Pivot Table Default Function

If you add a number field to the Values area, the default summary function is Sum. However, if the source data has blank cells, or nonnumeric data, such as text or errors, in that field, the Count function is the default summary function.

You can’t change the default settings for the data fields, but you can manually change the summary function after you add the fields to the Values area.

To manually change the summary function:

  1. Right-click a cell in the field you want to change, and click Summarize Data By.
  2. Click the summary function that you want to use.

SummarizeDataBy

Pivot Table Add-in

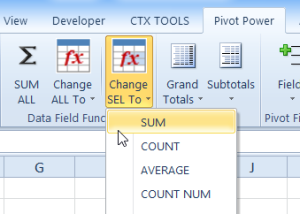
There’s a feature that changes all the data fields to SUM, or any other summary function, in my pivot table add-in. It add a new tab to the Ribbon, with time-saving commands that you can use.

  1. After you install the add-in, select any cell in the pivot table.
  2. Then, on the Ribbon’s Pivot Power tab, click SUM ALL.
  3. Or, click Change ALL to, then click the Summary function that you want to use.

sumselectedvalues

______________

For more information on Pivot Tables, please see the Pivot Table Tutorials on the Contextures Website.

_________________
New Pivot Items Out of Order

If you add new products to your pivot table source data, and refresh the pivot table, the new products will appear in the drop down lists. Sometimes though, the new items appear at the end of the list, instead of in alphabetical order. This problem can occur if you have manually rearranged the items in the Row Labels area.

For example, binders were just added to this pivot table’s source data. When the pivot table was refreshed, Binders appeared at the bottom of the Product list, instead of the top.

ListManualSort

Because it’s not in alphabetical order, it’s difficult to find the new product in the list. You’d like the product list sorted alphabetically.

Sort the List

If a field is set for Manual sort, new items will appear at the end of the drop-down list. Follow these steps to sort the field in ascending order:

  1. Right-click a cell in the Product field. For example, right-click the Envelopes cell.
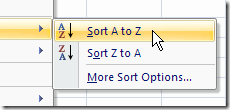
  2. Click Sort, and then click Sort A to Z.

SortAZ

When you sort the Product field, its sort setting changes from Manual to Sort Ascending or Sort Descending. This also sorts the drop-down list, and makes it easier for users to find the items they need.

______________

For more information on Pivot Tables, please see the Pivot Table Tutorials on the Contextures Website. _________________
Re-create Pivot Table Source Data Table

If you accidentally delete the Excel 2003 worksheet that has the source data for your pivot table, you may be able to use the pivot table’s Drill to Details feature to re-create it.

Extract the Pivot Table Data

To re-create the source data in Excel 2003, follow these steps to use the Drill to Details feature:

  1. Make sure that none of the items in the pivot table fields are hidden. For page fields, (All) should be selected. For row and column fields, (Show All) should be checked. Note: You don’t need to include all the fields in the pivot table before using the Drill to Details feature.
  2. Show the grand totals for rows and columns. If they aren’t visible, right-click a cell in the pivot table, and click Table Options. Check the options Grand totals for rows and Grand totals for columns, then click OK.
  3. Double-click the grand total cell at the bottom right of the pivot table. This should create a new sheet with the related records from the original source data.

Fix the Extracted Data

If the original source data contained formulas, you will have to re-create them, because the Drill to Details feature exports the data only.

The columns in the extracted data will be in the same order as they were in the original source data.

The extracted data will be formatted with Table AutoFormat List 3. You can apply a different AutoFormat, or apply your own formatting.

Note: If you had made changes to the source data and not updated the pivot table, those changes won’t be in the extracted data.

Connect to the Extracted Data

If you rename the sheet that was created during the Drill to Details process, and use the same name as the worksheet that originally held the source data, the pivot table might automatically connect to the new source data table.

If not, you can connect to the re-created source data:

  1. Right-click a cell in the pivot table, and choose PivotTable Wizard.
  2. Click the Back button, and select the new source data table range.
  3. Click Finish.


Show Text in a Pivot Table Values Area

A common question is “How can I show text in a pivot table’s values area, instead of numbers?”

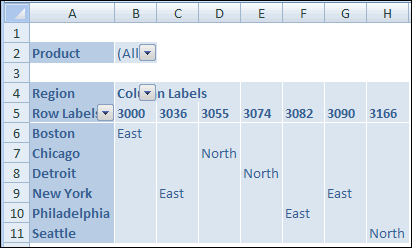
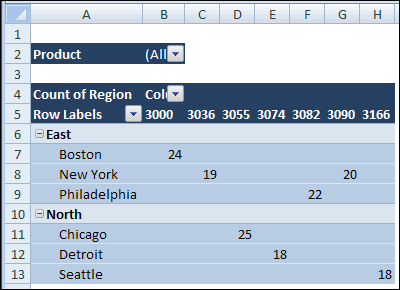
For example, if you add the Region field to the Values area, you’d like to see the region’s name, instead of a Count Of Region number.

PivotTextVal01

If you use Crosstab queries in Microsoft Access, you might have achieved this by using the First or Last summary function, instead of Sum or Count.

Unfortunately, the First and Last functions aren’t available in Excel pivot tables, so there’s no easy way to show text in the Values area.

Workaround #1 – Use the Row Fields

You could add the Region field to the Row Labels area, with the City field. Then add another field in the Values area to show a count of the regions. The layout won’t be exactly what you wanted, but it will show the region name.

PivotTextVal02

Workaround #2 – Create a Custom Number Format

In this example, there are only two region names, so you could use a custom number format to show the region names. You’ll assign a number to each region, then use that number in the pivot table. Note: This technique is limited to 2 items.

Create the Region Number field:

  1. In the source data, add a new column with the heading RegNum. In this column, type a 1 for East region orders and 2 for North region orders.
  2. Refresh the pivot table, so the RegNum appears in the Field List.
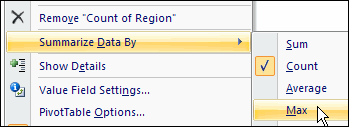
  3. Add the RegNum field to the Values area, and right-click on one of the numbers.
  4. In the popup menu, click summarize by Max.

PivotTextVal03

Apply a Custom Number Format:

  1. Right-click a Region value in the Values area in the pivot table.
  2. In the popup menu, click Number Format.
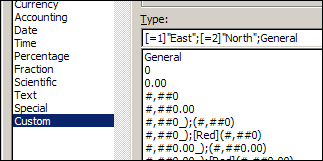
  3. In the Category list, click Custom.
  4. In the Type box, enter [=1]”East”;[=2]”North”;General
  5. Click OK, to close the dialog box.

PivotTextVal04

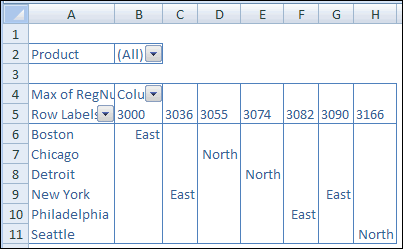
The pivot table will show the Region names, instead of the Region numbers.

PivotTextVal05

____________

Centre Column Headings in Excel Pivot Table

If your pivot table has column labels, and more than one field in the Values area, you might want to centre the column labels.

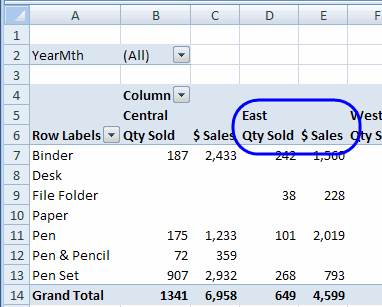
For example, in the pivot table shown below, there are Region headings in the Column Labels area. Below each Region label, there are headings for the Qty Sold and $ Sales fields.

LabelColCtr01

The East label is at the far left of its Qty Sold heading. It’s hard to tell which Region headings go with which Value headings.

To make the pivot table easier to read, you can centre the Region labels over their Value field headings.

To centre the column headings in Excel 2007:

  1. Select a cell in the pivot table
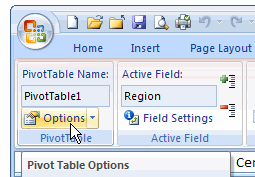
  2. On the Ribbon, under the PivotTable Tools tab, click Options
  3. At the far left, in the PivotTable group, click Options

RibbonPTOptions

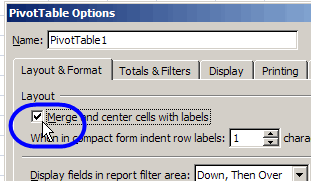
  1. On the Layout & Format tab, in the Layout section, add a check mark to Merge and Center Cells With Labels

LabelColCtr02

  1. Click OK

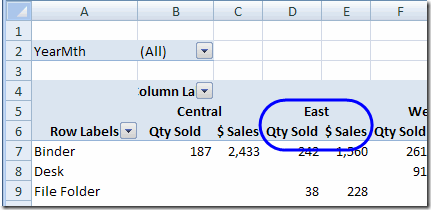
Each Region column label is now centred over its Value field headings.

LabelColCtr03


Hide Page Items in Excel 2003 Pivot Table

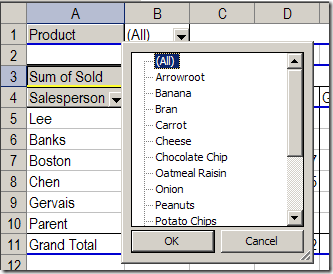
In Excel 2003, and earlier versions, the items in a page field’s dropdown list don’t have check boxes to indicate which items to show and which to hide, like there are in the Report Filters for Excel 2007 and later.

In the pivot table shown below, the Product field is in the page area.

PageHide01

It’s easy to select one product, such as Chocolate Chip. Or, you can select (All), and see the data for all the products.

However, you might want to hide some of the products instead of viewing the data for all the items. Without the check boxes, it’s not obvious how you can hide them.

Hide Some of the Page Items

Follow these steps to hide one or more of the page field items:

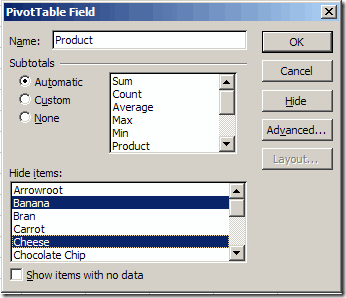
  1. Double-click the page field button to open the PivotTable Field dialog box.
  2. In the Hide items list, click on the items that you want to hide. In the screen shot below, Banana and Cheese will be hidden.

PageHide02

3.    Click OK to close the PivotTable Field dialog box.
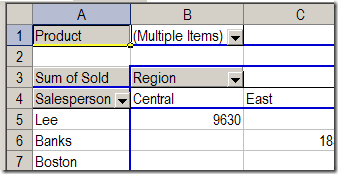
4.    Until you unhide the items, the page field will show (Multiple Items) instead of (All), unless an individual item is selected.

PageHide03

Tip: You could temporarily move the page field to the row area, remove checkmarks for the items you want to hide, and move the field back to the page area.

_________________
Pivot Table Error: Excel Field Names Not Valid

Usually, things go smoothly when you when you try to create a pivot table. However, occasionally you might see a pivot table error, Excel Field Names not Valid, if you try to build a new pivot table, or refresh an existing pivot table.

Updated Jan. 1, 2019 – macro to help with troubleshooting the pivot table error

Continue reading “Pivot Table Error: Excel Field Names Not Valid”

Modify a Pivot Table Calculated Item

After you create a calculated item in a pivot table, you might need to change its formula.

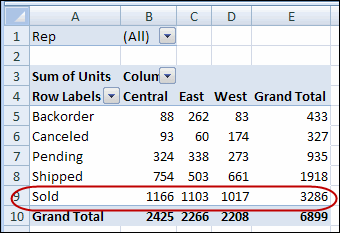
For example, in this pivot table there’s a calculated item named Sold, in the Order Status field. The Sold item sums the orders with a status of Shipped, Pending, or Backorder.

CalcItem01

Change the Calculated Item Formula

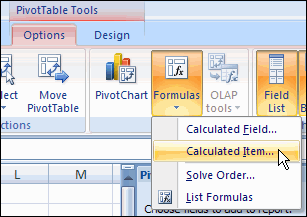
You can change the formula, so it doesn’t include the Backorder items. To do that, follow these steps to go back into the Insert Calculated Item dialog box and modify the calculated item.

  1. In the pivot table, one of the Order Status items. For example, select cell A6, which is the Canceled item.
  2. On the Ribbon, click the Options tab, under the PivotTable Tools tab.
  3. in the Tools group, click Formulas, and then click Calculated Item.CalcItem02
  4. In the dialog box, click the drop down arrow for the Name box.
  5. Select Sold, which is the name of the calculated item you want to change.CalcItem03
  6. In the Formula box, change the formula, to remove the +Backorder.CalcItem04
  7. The revised formula is =Shipped+Pending.CalcItem05
  8. Click Modify, to save the change, and then click OK to close the dialog box.

_________________
Create Two Pivot Tables on Excel Worksheet

In a comment on this blog, someone asked how to create two pivot tables on the same Excel worksheet.

NOTE: See the updated version of this Two Pivot Tables article, from July 2020.

Shown below is a worksheet named Pivot_Reports, with a pivot table on it, based on the data on the Sales_East sheet.

TwoPT01

We’ll add another pivot table to the Pivot_Reports sheet, based on data on the Sales_North sheet.

Add the Second Pivot Table

  • Select the Sales_North sheet, and select a cell in the data table.
  • On the Ribbon, click the Insert tab
  • In the Tables group, click PivotTable (click the top half of the PivotTable command).

RibbonInsertPT

  • In the Create PivotTable dialog box, at the top, leave the default selection of Select a Table or Range, where the Sales_North table shows.
  • In the lower section, click Existing Worksheet.
  • Click in the Location box, then click on the sheet tab for the Pivot_Reports sheet.
  • Click on the cell where the second pivot table should start.

TwoPT02

  • Click OK to create the new pivot table.
  • Add the fields that you’d like in the new pivot table.

The second pivot table is added to the Pivot_Reports worksheet.

TwoPT03

Prevent Pivot Table Overlap

When you have two or more pivot tables on the same worksheet, be careful to prevent them from overlapping.

PTOverlap

Before you add new fields to the pivot table on the left, you might have to add blank columns between the pivot tables. Or, if one pivot table is above the other, add blank rows between them.

If the pivot tables will change frequently, adding and removing fields, it may be better to keep the pivot tables on separate sheet.

This short video shows pivot table refresh problems, and how to avoid them. For detailed written notes, go to the Pivot Table Errors page on my Contextures site.

Related Articles

Create a Pivot Table In Excel

Create Two Pivot Tables On Excel Worksheet

____________