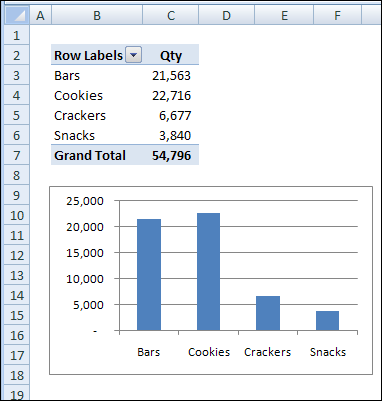
Pivot Table Summary Functions: Count

When you add a field to a pivot table’s Values area, Count is the default summary function, if the field contains nonnumeric or blank cells. (If the field’s data are all numbers, Sum is the default function.)

The Count function’s name is slightly confusing, because it’s like the COUNTA worksheet function, not the COUNT worksheet function.

The pivot table Count function counts:

  • text
  • numbers
  • errors

Blank cells are not counted.

Watch What You Count

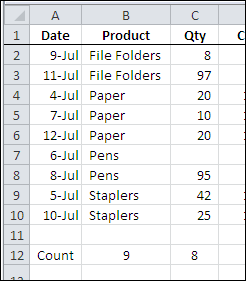
If you’re using the Count function in a pivot table, be careful which field you use for the count. For example, in the pivot table source  data shown below, cell C7, in the Qty column, is blank.

pivottablecount01

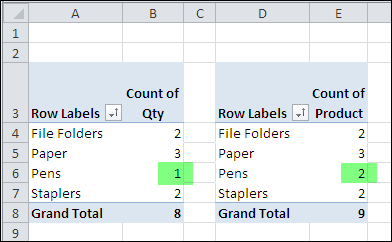
if you want to count the order for Pens, and use the Qty field, the blank cell (C7) would not be counted. The number of orders for Pens would show as 1. Instead, you could add the Product field to the Values area, and the Pens orders would show a count of 2.

In the pivot tables shown below, the one on the left uses Qty in the Values field, and the pivot table on the right uses Product in the Values field.

pivottablecount02

__________

Create an Excel 2007 Pivot Table and Show Averages

This example is based on the Work Orders workbook, used in my book, Beginning PivotTables in Excel 2007.

If you’re working through the book, this video shows the steps outlined starting on page 46.

In the video, we create a pivot table that’s based on a formatted Excel Table.

Then, the Values field is changed from SUM to AVERAGE, and the numbers are formatted so they’re easy to read and understand.

___________________

Grouping Pivot Table Dates by Months and Weeks

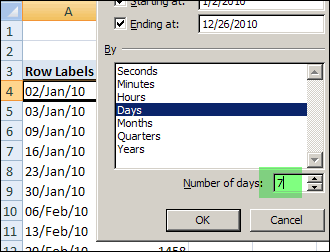
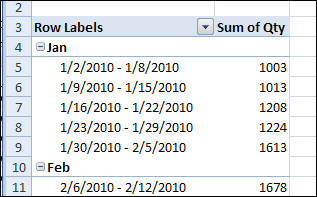
In a pivot table, there’s no built-in way to group the pivot table data by both weeks and months at the same time. If you want to show sales data by week, you can group the date field in seven-day intervals.

groupweekmonth01

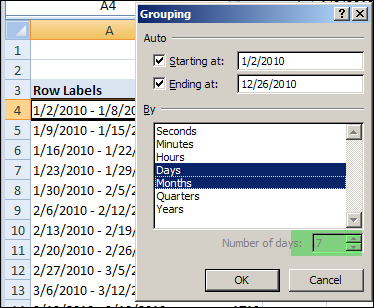
The 7 day grouping works well, but if you try to add grouping by months, the Number of Days option is disabled. If you select Month in the Grouping dialog box, the days will lose their 7 day grouping.

groupweekmonth02

Calculate the Month

Since you can’t group by both week and month, you can use a workaround instead. You could create a column in the source data, and then calculate one of the grouping levels there. Then, you could add that field to the pivot table.

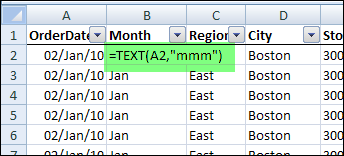
For example, you can add a column that calculates the month name for each sales order date, by using the TEXT function:

=TEXT(A2,"mmm")

groupweekmonth03

Add the Month field to the pivot table, above the weeks.

groupweekmonth04

Calculate the Week Number

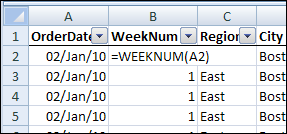
Another option is to add a column to the source data, with a formula to calculate the week number:

=WEEKNUM(A2).

groupweekmonth05

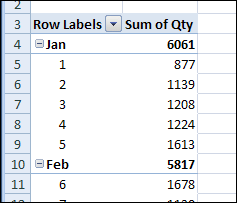
With the OrderDate field in the Row Labels area, group the dates by months. In the Row Labels area, add the WeekNum field below the OrderDate field, to summarize the data by month and week number.

groupweekmonth06

Note: If a week begins in one month and ends in another, it will appear under both months.

________________

Quickly Hide Selected Items in Excel Pivot Table

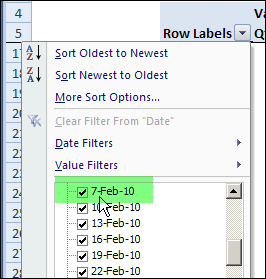
In an Excel pivot table, you might want to hide one or more of the items in a Row field or Column field. To do that, you can click the drop down arrow for the Row or Column Labels, then remove the check mark for items you want to remove.

For example, to hide the data for 7-Feb-10, you’d click on the check mark to remove it.

pivothidesel01

A Quick Method to Hide Items

Instead of searching through a long list of items in a drop down list, you can use a quick command to hide the selected items.

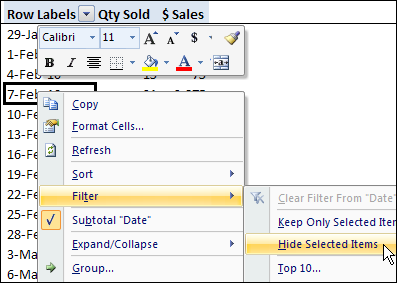
  1. Right-click on an item in the Row Labels or Column Labels
  2. In the pop-up menu, click Filter, then click Hide Selected Items.
  3. The item is immediately hidden in the pivot table.

pivothidesel02

Quickly Hide All But a Few Items

You can use a similar technique to hide most of the items in the Row Labels or Column Labels.

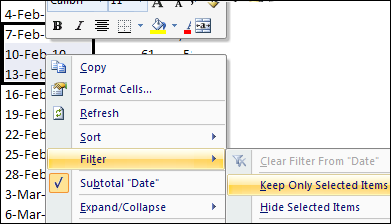
  1. Select the pivot table items that you want to keep visible
  2. Right-click on one of the selected items
  3. In the pop-up menu, click Filter, then click Keep Only Selected Items.
  4. All but the selected items are immediately hidden in the pivot table.

pivothidesel03

Watch the Pivot Table Tutorial Video

To see the steps for quickly hiding or keeping the selected items in an Excel 2007 Pivot Table, you can watch this short video tutorial.

____________

Create a Custom PivotTable Style

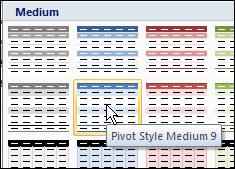
There are many built-in PivotTable styles in Excel 2007, but you might not see one that has the exact formatting you need. For example, you might like the heading colors in the Pivot Style Medium 9, but you’d like a different color in the subtotal row.

pivotcustomstyle

Instead of using one of the built-in PivotTable styles, you can create a custom PivotTable style with the formatting you prefer. You can either duplicate an existing Pivot Table style, and modify the duplicate, or you can create a new style from scratch.

Copy an Existing PivotTable Style

If you find a PivotTable style that’s close to what you need, you can duplicate that style, and modify the duplicate. Follow these steps to create a custom style, based on an existing style:

  1. Select a cell in the pivot table, and on the Ribbon, click the Design tab.
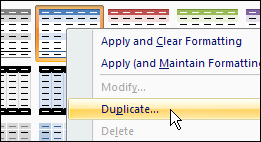
  2. In the PivotTable Styles gallery, right-click the style you want to duplicate.
  3. In the context menu, click Duplicate.

pivotcustomstyle02

Next, follow the steps in the Modify the PivotTable Style section (below), to name and modify the new style.

Create a New PivotTable Style From Scratch

If you don’t see anything similar to what you need, you can create a new style from scratch. Follow these steps to create a new style.

  1. Select a cell in the pivot table, and on the Ribbon, click the Design tab.
  2. In the PivotTable Styles gallery, click New PivotTable Style (at the bottom of the PivotTable Styles gallery)

pivotcustomstyle03

Next, follow the steps in the Modify the PivotTable Style section (below), to name and modify the new style.

Modify the PivotTable Style

After duplicating or creating a PivotTable style, follow these steps to name the style and set the formatting.

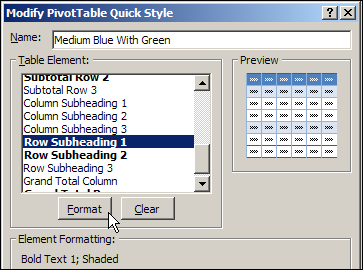
  1. In the Modify PivotTable Quick Style dialog box, type a name for the new PivotTable style. (If you created a new style, the dialog box will be named New PivotTable Quick Style.)
  2. To modify an element’s formatting, click it to select it, and then click the Format button. (Note: In the Table Element list, the elements in bold font have formatting applied. You can modify or clear that formatting. You can also select unformatted elements and format them.)pivotcustomstyle04
  3. In the Format Cells dialog box, select the Font, Border, and Fill settings you want for the selected element.
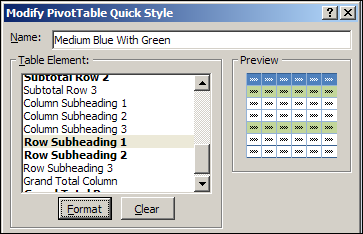
  4. Click OK, to return to the New PivotTable Quick Style dialog box, where the formatted element is listed with a bold font. In the screenshot below, you can see the revised color in the Preview section.pivotcustomstyle05
  5. Repeat Steps 2 to 4, for any other elements that you want to format.
  6. (optional) If you want your custom style to be the default PivotTable style, add a check mark to Set As Default PivotTable Quick Style For This Document.pivotcustomstyle06
  7. Click OK, to close the New PivotTable Quick Style dialog box.

Apply the Custom PivotTable Style

The new PivotTable style that you created will not be automatically applied to the active pivot table. Follow these steps to apply your custom style.

  1. Select a cell in the pivot table that you want to format.
  2. Open the PivotTable Styles gallery.
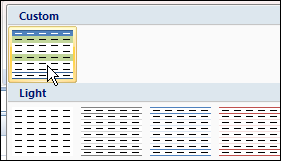
  3. The custom PivotTable Style you created is added to a Custom section at the top of the PivotTable Styles gallery.
  4. Click your custom style, to apply it to the active pivot table.

pivotcustomstyle07

__________

Sort Pivot Table Field Left to Right

In a pivot table, you usually sort the data by the values in a column, such as the Grand Total column. By sorting, you can highlight the highest or lowest values, by moving them to the top of the pivot table.

To sort a pivot table column:

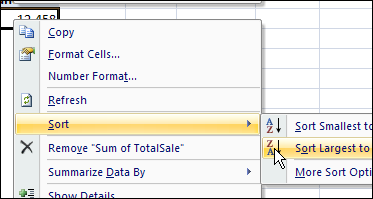
  • Right-click on a value cell, and click Sort.
  • Then, click Sort Smallest to Largest or Sort Largest to Smallest

pivotsortrow01

Sort a Pivot Table Row

You can also sort a pivot table row by its values, left to right. This moves the largest or smallest amounts to the left of the pivot table, so you can focus on them.

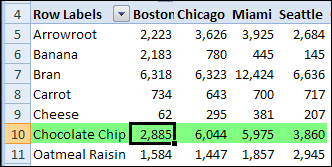
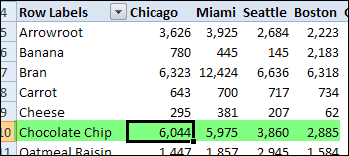
For example, in the pivot table shown below, you can sort the Chocolate Chip row, so sales per city are sorted in descending order. Currently, the cities columns are in alphabetical order, with Boston at the left.

pivotsortrow00 

To sort a pivot table row:

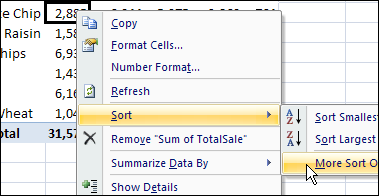
  1. In the pivot table, right-click a value cell in the Chocolate Chip row.
  2. Click Sort, and then click More Sort Options

    pivotsortrow02
     

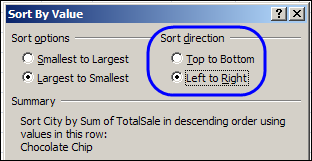
  3. In the Sort By Value dialog box, under Sort Options, select Largest to Smallest.
  4. Under Sort direction, select Left to Right. In the Summary section, you can see a description of the sort settings.

    pivotsortrow03 

  5. Click OK to close the dialog box.

View the Results

The values in the Chocolate Chip row are sorted largest to smallest, from left to right. The City column order has changed, and Chicago, which has the highest Chocolate Chip sales, is at the left.

pivotsortrow04

Rows for other products may not be in descending order, because the column order has been set by the values in the Chocolate Chip row.

______________

Change Summary Function for Pivot Table Subtotal

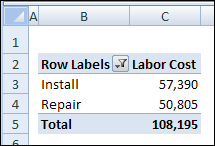
When you add a field to the Values area of an Excel Pivot Table, it automatically shows the Sum or Count for all the items in that field. Here we can see the total labor cost for each Service Type.

pivotsubtotal00

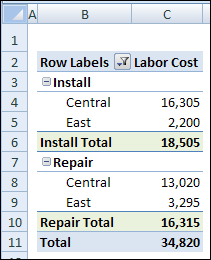
If you add more than one field to the Row Labels or Column Labels area of the Pivot Table, a subtotal is automatically created for each field except the last one (the Inner Field). The subtotal, by default, uses the same summary function as the Value field.

In our example, the District field has been added to the Row Labels area. Service Type is now an Outer Field, and has a subtotal for each service. District is the Inner Field, and does not have subtotals.

pivotsubtotal01

Change the Subtotal Summary Function

Instead of using the default summary function for subtotals, you can select a different function. To change the setting:

  1. Right-click a label for the field in which you want to change the subtotal. In this example, right-click cell B3, which has the Install label.
  2. In the pop-up menu, click Field Settings
  3. In the Field Settings dialog box, click the Subtotals & Filters tab
  4. Under Subtotals, click Custom
  5. In the list of Summary Functions, click one or more function names
  6. Click OK to close the dialog box.

Subtotals on Inner Fields

For the Inner Field in the Row Labels or Column Labels area, the default subtotals are not displayed. So, in the pivot table shown above, there’s no subtotal for the District field.

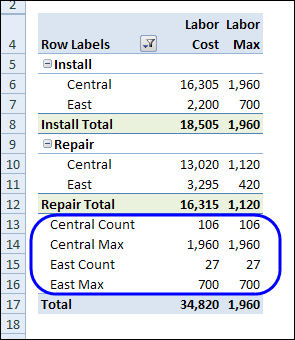
However, if you create Custom Subtotals for an Inner Field, those subtotals appear at the end of the Pivot Table. In this example, Custom subtotals for Count and Max were created for the District field. You can see the District subtotals at the bottom of the Pivot Table, just above the Grand Total.

pivotsubtotal04

More Info on Pivot Table Subtotals

You can read more about pivot table subtotals, and the steps for changing them, on the Contextures website: Excel Pivot Table Subtotals.

Watch the Pivot Table Subtotals Video

To see the steps for changing the pivot table subtotals, and creating multiple subtotals, you can watch this short video.

___________

Changing Pivot Chart Layout Affects Pivot Table

If you rearrange the fields in a pivot chart layout, the related pivot table changes too. Unfortunately, there’s no setting you can change if you want the pivot chart and pivot table to work independently.

pivotchartchange

As a workaround, you can create a second pivot table, based on the first one, and arrange it as you’d like. Then, when you change the pivot chart, only the original pivot table is affected. You can hide the first pivot table that’s connected to the pivot chart and use the second pivot table as for printing reports.

If you require several charts based on the same pivot table, but with different layouts, create multiple pivot tables based on the original pivot table. Create one pivot chart from each of the secondary pivot tables, and rearranging one pivot chart won’t affect the others.

___________

Summarizing Formatted Dates in Excel Pivot Table

If you format a column of dates in your pivot table source data, to show as year and month (yyyy-mm), they won’t automatically summarize by year and month in the pivot table.

Format the Source Data

For example, in the source data shown below, there are several orders for January 2010, and three different dates are visible.
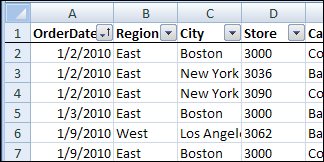
dateformat01

If you format those records as yyyy-mm, it looks like all the dates are the same.
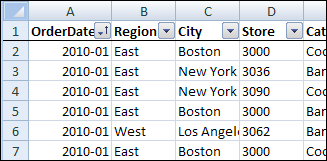
dateformat02

Summarize Formatted Dates

However, when you add the OrderDate field to the Row Labels area of a pivot table, several items appear as 2010-01, instead of only one item.
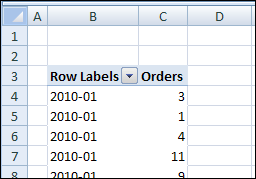
dateformat03

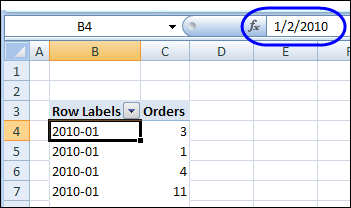
The first instance of 2010-01 shows 3 orders, so that would be the Jan 2, 2010 orders. Below it is an item with a single order, and that’s a summary of the Jan 3, 2010 orders.

Even though the dates are formatted to look the same in the source data, the underlying dates are still recognized by the pivot table. Those underlying dates are used for the pivot table summary. If you click a date in the Row Labels, you see the underlying date in the formula bar. Because the dates are different, each date is listed individually.
dateformat04

Group the Dates

Instead of formatting, you can group the dates in the pivot table to combine the data by month and year.

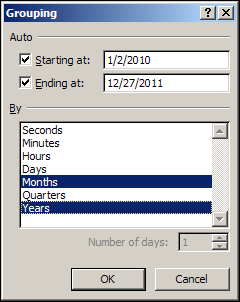
  1. Right-click an OrderDate row label, and then in the context menu, click Group.
    dateformat05

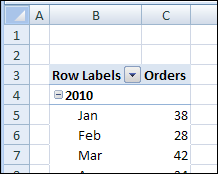
  2. In the Grouping dialog box, in the By list, select Months and Years, and then click OK.

The orders will be grouped by year and month, showing a total of 38 for January 2010.
dateformat06

Calculate the Year and Month

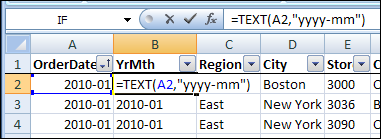
Grouping can cause some problems in a pivot table, such as preventing you from using calculated items. If you don’t want to using grouping, you could add a new column to the source data, and enter a formula that converts the dates to text. Then, all the dates that have the same year and month will calculate to the same text string.

In our example, the order dates are in column A.

  1. Add a blank column to the source data table, with the heading YrMth.
  2. In the cell below the heading, type the formula =TEXT(A2,”yyyy-mm”) dateformat07
  3. Copy the formula down to the last row of data in your table. (Note: If your data is in an Excel Table, the
    formula should fill down automatically.
  4. Refresh the pivot table, so you can see the new YrMth field in the PivotTable Field List.
  5. Add the YrMth field to the pivot table Row Labels area.
  6. Remove the old OrderDate field from the pivot table layout.

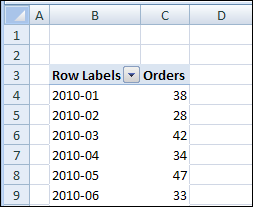
The orders are grouped by year and month, showing a total of 38 for January 2010.
dateformat08

_________________