A pivot table is a great way to summarize data in Excel, and you can show sums, counts, averages, and other functions.

Use Custom Calculations
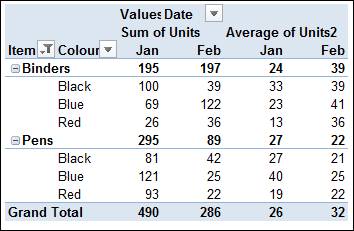
In addition to the different functions, you can apply custom calculations to the values. They’re simple to use, and let you show running totals, differences between items, and other calculations.
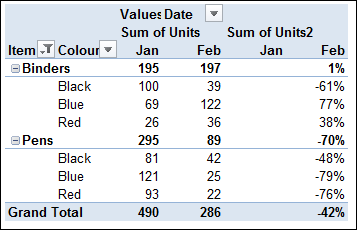
For example, in the screen shot below, you can see the change in units sold, based on the previous month’s sales.

New Custom Calculations
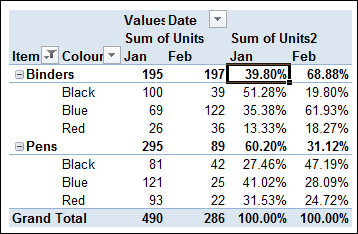
In Excel 2010, a few new custom calculations were added, including % Parent Row Total and % Parent Column Total. These two calculations let you see an item’s percentage, based on its parent’s subtotal amount.
In the screen shot below, the % Parent Row Total was applied, and you can see the percentage for each colour’s sales, compared to the item’s total, in each month.

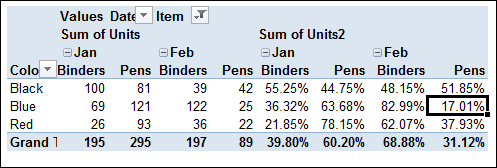
If the fields are arranged horizontally, you can use the % Parent Column Total instead. In the screen shot below, you can see the percentage for each item’s sales, compared to the month’s total, for each colour.

Video: % of Parent Custom Calculations
To see the steps for creating a % of Parent custom calculations, please watch this short video.
Download the Sample File
For more information on Custom Calculations, and to download the sample file, please visit my Contextures website: Pivot Table Custom Calculations.
_____________

I am attempting to use your demonstration of showing percent of sub-total in a pivot table. When I attempt to drag another copy of the field into the value area, I receive an error “Multiple data fields of the same field are not supported when a PivotTable report has calculated items.” Do you know why I receive this error?
Adding follow up via email