Previously, we’ve looked at the pivot table summary functions: Count, Average, Min and Max and Product. In this article we’ll look at the Var and Varp summary functions.
Var Function and Varp Function
Like the VAR.P and VAR.S worksheet functions, the Var and Varp summary functions calculate the variance for the underlying data in the Values area, and is the square of the standard deviation. Like the standard deviation, variance is a measure of how widely the values vary from the average of the values.
The VarP summary function is used when the entire population is used in the calculation. If a sample of the data is used, instead of the entire population, then use the Var summary function.
VAR.P Worksheet Function
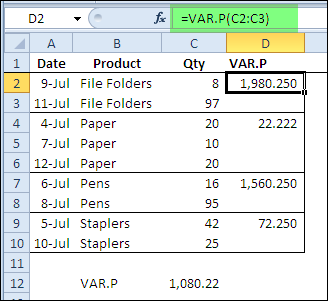
Shown below is the pivot table source data, and the VAR.P worksheet function is calculating the variance for each product type. There is a large difference between the quantities of file folders sold, and the variance is 1980.25. For the paper sales, the difference in quantity is much smaller, and the variance is only 22.22.

Pivot Table Varp Summary Function
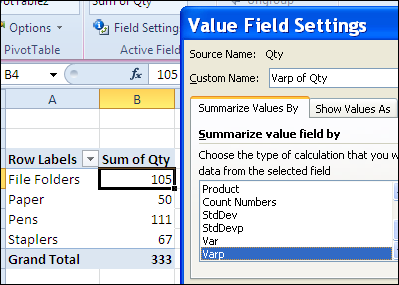
To use the Varp summary function, when the Qty field is added to the pivot table, change the summary calculation to Varp.

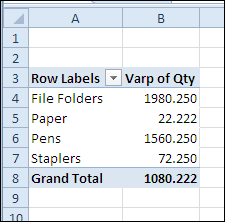
The variances shown in the pivot table are the same as those that were calculated on the worksheet.

Note: If the count of items is one, a #DIV/0! error is displayed when using the Var summary function, because one is subtracted from the count when calculating the variance.
How the Variance is calculated
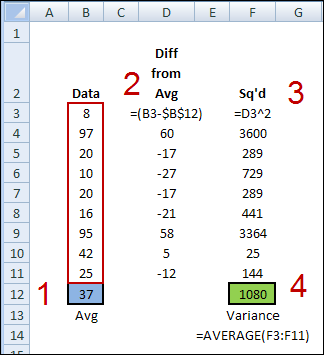
In the variance, each number is compared to the mean of the numbers. If you were to calculate the variance on the worksheet, without the VAR.P function, here’s how you would do it.
- Find the average of the numbers in the pivot table data.
- From each number, subtract the average.
- Square the calculated difference for each number
- Find the average of the squared difference.

_______________
