Quickly check your sales results over time, or by top products, with the % Running Total feature in an Excel pivot table. This feature is available in Excel 2010, and later versions.
Sales Progress by Month
There’s a built-in pivot table feature – % Running Total – that makes it easy to see how your sales progressed, over the months in a year.
For example, when the year was half over, had you made 50% of your annual sales? Less than 50%? More than 50%
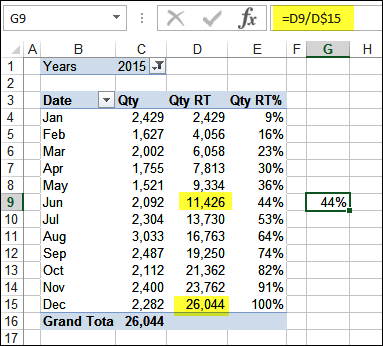
In the pivot table shown below, I’ve added the sales quantity to the pivot table 3 times, to show the sales in 3 different ways:
- Column C: sum of sales quantity
- Column D: sum of sales quantity – Running Total
- Column E: sum of sales quantity – % Running Total (Running Total / Grand Total)
Only 44% of sales were in the first 6 months, so things went better in the second half of the year
Note: To apply the Running Total and % Running Total calculations, right-click on one of the values, then point to the Show Values As command, in the pop-up menu
Video: Sales Progress by Month
In the video below, you can see the steps for setting up the pivot table, and adding the Running Total, and % Running Total calculations.
There are written steps, and sample files to download, on the Pivot Table Running Totals page, on my Contextures site.
Video: Running Total and Rank
In this video, I combined the % Running Total calculation with the Rank calculation, in a sales pivot table.
That lets us see what percentage of total sales come from the top 2 or 3 products.
With that information, you can plan where to invest your marketing time and budget!
Get the Sample Files
There are more Running Total examples, and sample files to download, on the Pivot Table Running Totals page, on my Contextures site.
Tip: In addition to Running Total and % Running Total, there are many more ways to show the data in your pivot tables. To see more examples, such as Difference From, Rank and % of Parent, go to the Show Values page on my Contextures site.
_____________________
Check Sales Progress with Percent Running Total in Excel Pivot Table
_____________________


