When you create a pivot table to summarize data, Excel automatically creates sums and counts for the fields that you add to the Values area. In addition, you might want to see a distinct count (unique count) for some fields, such as:
- The number of distinct salespeople who made sales in each region
- The count of unique products that were sold in each store
Normal Pivot Tables
For a normal pivot table, there isn’t a built-in distinct count feature in a normal pivot table. However, in Excel 2013 and later versions, you can use a simple trick, described below, to show a distinct count for a field.
For older versions of Excel, try one of the following methods:
- In Excel 2010, use a technique to “Pivot the Pivot table”.
- In Excel 2007 and earlier versions, add a new column to the source data, and Use CountIf.
Add to Data Model – Excel 2013 and Later
In Excel 2013, if you add a pivot table’s source data to the workbook’s Data Model, it is easy to create a distinct count in Excel pivot table.
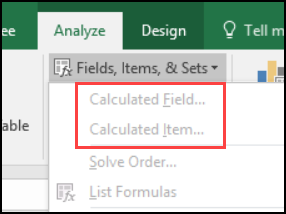
NOTE: This technique creates an OLAP-based pivot table, which has some limitations, such as no ability to add calculated fields or calculated items. If you need the restricted features, try the “Pivot the Pivot” method instead.
Video: Count Unique in Excel Pivot Table
In this short video, I show how to count unique items (distinct count) in a Microsoft Excel pivot table. This method works in Excel 2013 and later versions.
The Sample Data
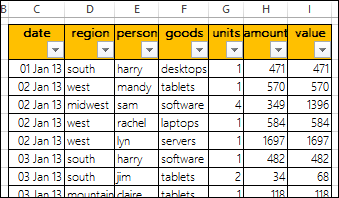
In this example, there are 4999 records that show product sales, with the region and salesperson name. The first few records are shown in the screen shot below.
You can download the sample workbook from my Contextures website. On the Pivot Table Unique Count page, go to the Download section, and click the link.
Create the Pivot Table
First, to create a pivot table that will show a distinct count, follow these steps:
- Select a cell in the source data table.
- At the bottom of the Create PivotTable dialog box, add a check mark to “Add this data to the Data Model”
- Click OK
Set up the Pivot Table Layout
To set up the pivot table layout, follow these steps:
- In the pivot table, add Region to the Row area.
- Add these 3 fields to the Values area — Person, Units, Value
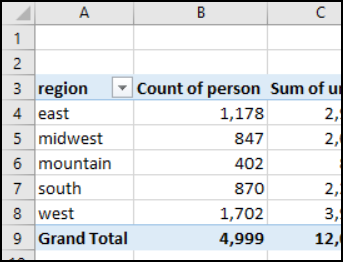
- The Person field contains text, so it defaults to Count of Person. The count shows the total number of transactions in each region, not a unique count of salespeople
Show a Distinct Count
To get a unique count (distinct count) of salespeople in each region, follow these steps:
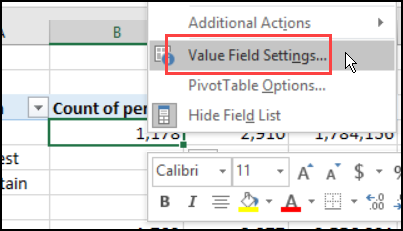
- Right-click one of the values in the Person field
- Click Value Field Settings
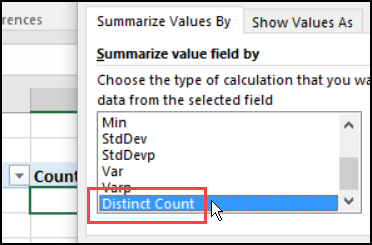
- In the Summarize Value Field By list, scroll to the bottom, and click Distinct Count, then click OK
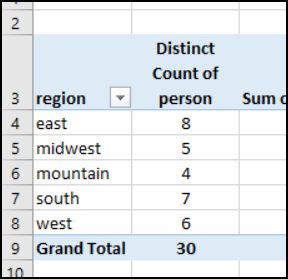
The Person field changes, and instead of showing the total count of transactions, it shows a distinct count of salespeople names.
Distinct Count in Excel Pivot Table Workbook
To download the sample workbook, go to the Pivot Table Unique Count page, on my Contextures website. On that page, go to the Download section, and click the link.
That page also has instructions for calculating a unique count in older versions of Excel.
Video: Show Distinct Count in Excel 2013 With PowerPivot
To see the steps for showing a distinct count with PowerPivot, please watch this video.
_________________________


The links in
“In Excel 2010, use a technique to “Pivot the Pivot table”.”
and
“In Excel 2007 and earlier versions, add a new column to the source data, and Use CountIf.”
link to *this* page.
Thanks! I’ve fixed the links.
Thanks, Debra.
Hi
I have a unique problem. Want Distinct Count of Dealer over a series of month. Can this be done.
Eg:
Dist. Dealer Apr May Jun Jul
ABC XYZ 1 0 2 1
ABC XYZ1 0 1 3 1
I want to know how can i get a distinct count over a series of dealer name over different months
Hi. Could anyone please help on this topic where i have added 15 pivots already without ticking the option “add this to data model” while making the pivots, however now i need a distinct count and that is possible through ticking it before making the pivot.
How can i go back and tick this option to get the distinct count option on all 15 pivots? I cannot redo all the pivots since its too tediou
You can’t. You have to do it when creating the original pivot unfortunately