If you’re working with dates in a pivot table, it’s easy to group them by years, months or days – those are options in the Group By dialog box.
However, sometimes you might need a different type of date grouping. In this example, we’d like to group the sales data into 4-week periods, to match our company’s sales calendar. Keep reading to see the steps to set that up, and make sure the period starts on the correct weekday.
Also, you can read more about pivot table grouping on my Contextures website.
Video: Group Dates by 4-Week Periods
Watch this video to see how to group the date field in 4-week periods, and set the starting date. There are written instructions below the video.
Group Dates by 4-Week Period
In each of our sales periods, there are 4 weeks. There’s no option for grouping by Weeks, but we could use the Days option instead. With a bit of simple arithmetic, we can calculate the number of days per period:
- 7 days per week
- 4 weeks per period
- = 28 Days per Period
Follow these steps to group the dates into 4 week periods:
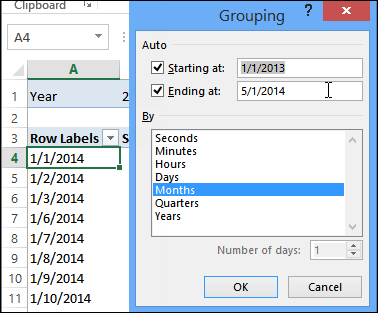
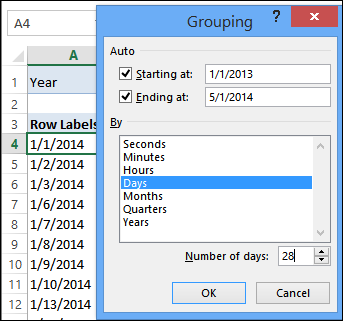
- Right-click on of the dates, and click Group
- In the Grouping window, click on Days, to select it
- If any other grouping types are selected, click on them, to unselect them
- Set the number of days to 28
- NOTE: To group dates into 1-week periods, use 7 as the number of days.
Using the Default Starting Date
As a starting date, Excel automatically selects the first date in your source data. In the the screen shot above, you can see that January 1, 2013 is the starting date in this source data.
If I check in Outlook, that date falls on a Tuesday.

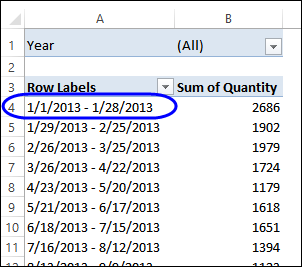
If I click OK in the Grouping window, Excel will create periods that start on a Tuesday. In the grouped dates shown below, the first period goes from Tuesday, January 1, 2013, to Monday, January 28, 2013.
Fix the Starting Date
Instead of using the default starting date, you can enter a different date, to get the starting date you need.
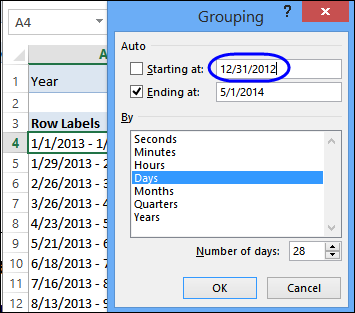
In this example, we’ll change the starting date to December 31, 2012. That date falls on a Monday, so this forces all the groupings to start on a Monday, which matches the company’s sales periods.
To fix the starting date:
- Right-click on one of the grouped date cells in the pivot table
- Click Group
- In the Grouping window, change the starting date – December 31, 2012
- NOTE: The Auto check box for “Starting at” is automatically cleared – leave it unchecked.
- Click OK
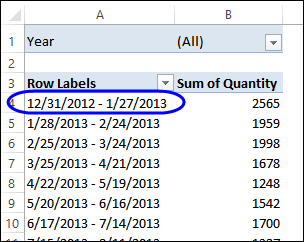
Now the periods are grouped correctly, with a Monday as the starting date for each period.
Pivot Table Grouping
For more examples of pivot table grouping, go to the How to Group Pivot Table data page on my Contextures website
_____________________

Hi Debra – Great tutorial! To group by week only, you can change the “Number of days:” box to 7 in the Grouping window. This would create a the following groupings…
1/1/2013 – 1/7/2013
1/8/2013 – 1/14/2013
I think this is the result I was expecting to see based on the title of the article. You probably already have this technique somewhere else on your site. I’m sure I learned it from you. 🙂 Thanks!
Thanks Jon, and I added a link to those instructions on my site.
Hi
Im needing to do a similar group using the 7 day grouping as showing data on a week commencing basis.
Im struggling with a couple of things.
1. How can I show on a pivot chart the year on year analysis based on the week com (x-axis)?
2. How can I show the week commencing date (rather than the week commencing no.?
Thanks, Stuart