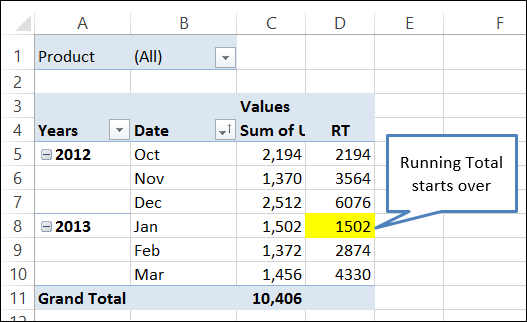
A quick way to show how amounts accumulate over time is to build a pivot table, and show the values as a running total.
However, if you group the dates by year and month, the running total stops at the end of each year, and starts again at the start of the next year. There is no setting you can adjust to change this behavior.

Create a New Field in the Source Data
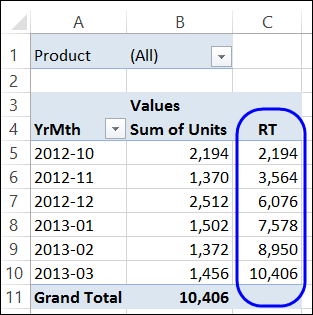
If you’d like the running total to continue from one year to the next, you can add a new field in the source data, to calculate the year and month in each record. Then, use that Year-Month field as the base for the running total:
- Add a column to the source data, with the heading YrMth.
- Enter a formula to return the year and month of the date in each row. For example, use this formula if the date is in Column A: =TEXT(A2, “yyyy-mm”)
- Refresh the pivot table, add the YrMthfield to the Row Labels area, and remove the Date and Year fields.
- Create a running total with YrMth as the base field.

Video: Running Total Stops at Year End
To see the steps for creating a running total that continues from one year to the next, please watch this video tutorial.
Download the Sample File
To download the sample file for this video, please visit my Contextures website: Running Total Year to Year
______________

Hi, I have a question about this topic.
I have some amounts in one column, and this amounts represent a batch process. Therefore, in one moment (periodically) this amount is 0 (when a new batch starts because the previous one is full) and it starts to increase again. So I want the cumulative sum but in the moment in that the amount is 0, the cumulative sum should start from 0. At this moment, I have only found the formula which does the cumulative sum, but I don’t know how to “reset” the cumulative sum in the moment that the amount is 0. I would be so grateful if you could help me. Thank you.
Very useful tip.
Thanks a lot!
Thank you!
Huge thanks for this great tip! Still works (and needed) in 2021