In a pivot table, you can show multiple subtotals for a field, such as Sum, Count and Average. However, there isn’t a setting that lets you show multiple Grand Totals.
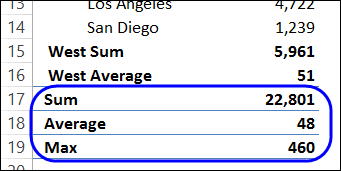
With a simple workaround, you can replace the Grand Total with a new field, and show two or more Grand Total calculations. In the screen shot below, the Sum, Average and Max are being calculated.

Add a New Field in the Source Data
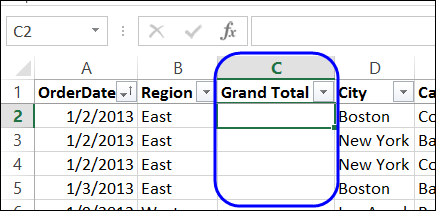
This solution uses a new field in the pivot table’s source data, with a heading cell, and nothing else in the column.

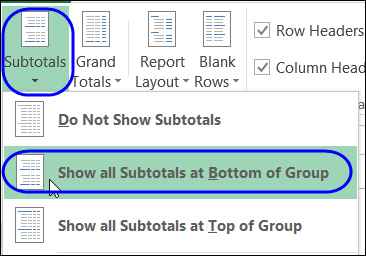
That field is added to the pivot table, and subtotals are moved to the bottom of each group.

For written instructions, please visit my Contextures website: Pivot Table Grand Totals
Watch the Video
To see the steps for showing multiple grand totals, please watch this short video tutorial.
_______________________

Deb, that is super super clever. How the heck did you stumble upon that?
Thanks Jeff! It was a long time ago, so I can’t remember exactly how or when I discovered this feature.
Debra, Is this still possible in Excel 2013. I do not see the custom option in Field Value Settings when I right-click on the label for the grand totals.
@David, you have to add a new field to the data, and use that field as a dummy Grand Total. There are written instructions on my Contextures website, that will explain the details.
http://www.contextures.com/xlPivot13.html#TotalMulti
I was wondering if you could advise on how I can show the grand total of my pivot table to show the sum of the average amount in my pivot table. In other words, the pivot table has average in the columns and the grand total will show the total of the averages.
Regards.