You might have used one of the Custom Calculations in a pivot table, such as % of Column or Running Total. There’s another Custom Calculation – Index — that isn’t used very often, but provides an interesting look at the pivot table values.
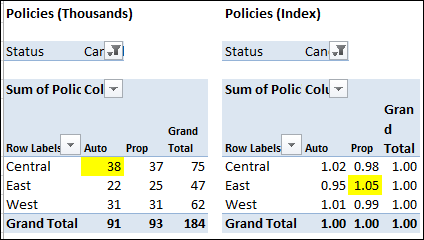
In the screen shot below you can see the original data in the pivot table, and the same date using the Index custom calculation. Even though Central Auto is the highest value in the table at the left, East Property has the highest Index value.

Using the Index custom calculation gives you a picture of each value’s importance in its row and column context.
- If all values in the pivot table were equal, each value would have an index of 1.
- If an index is less than 1, it’s of less importance in its row and column
- If an index is greater than 1, it’s of greater importance in its row and column.
The Index Formula
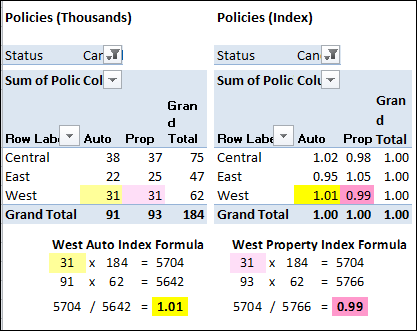
Even if two cells have the same value, they may have a different index. The Index formula is:

So, in this example, in the West region, the values for Auto and Property are almost equal, but the index for the Auto is 1.02 and Property is 0.98.
Because the grand total is higher for the Property column, the Grand Column Total in the Index formula is larger. The West Property amount is divided by this larger number, and its resulting index is smaller.

Read more about Index and the other Pivot Table Custom Calculations on my Contextures website.
______________________
