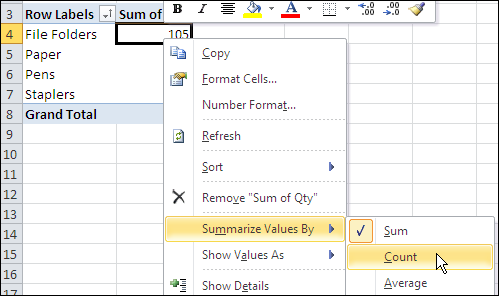
It’s easy to change the summary function for one data field in a pivot table. For example, if a field shows the Sum of Units, you can right-click on that field, and change it to Count of Units.

However, if you have several data fields in a pivot table, it can take quite a bit of time to change each pivot table summary function manually.
Create a Worksheet List of Functions
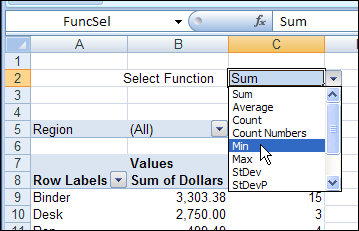
To make it easy for yourself, or other people who use the pivot table, to change the functions, you can add a drop down list of functions in a worksheet cell.

The list is created with Excel data validation, and Excel VBA code runs when a different function is selected in that cell. The code changes the summary function for all the data fields in the pivot table.
Read the Details
For details on how the code works, you can read the Select Pivot Table Function From Worksheet Drop Down article on the Contextures blog.
Download the Sample File
To test the Summary Function code, you can download the sample file from the Contextures blog link above. The file is in xlsm format, and zipped. Enable macros when you open the file.
________________

Is there a way to filter the top 10, but retain the complete grand totals? As an example, if I were to filter the top 10 of % of column, the “grand total” may only be 50%, showing that the top 10 represent 50% of the total report. Another example would be to filter the top 10, but the Grand total would show the grand total of the data, not just the total of the top 10.
Thanks.
@Carl, no, if you filter for top 10, only those items will be included in the grand total. You could use 2 pivot tables, and show the grand total in one, and the filtered results in the other.
Hello
Can anyone help me. I’m stuk with a privot table.
I have a datasheet with customers list on the left. Orders cost and date the order placed I have in the column titiles. I have many orders and dates.
I need to create a pivot table where I can see how much money I generated in a particular month and year based on all orders/dates and cutomers.
Thank you