You can group pivot table data, as an easy way to see subtotals.
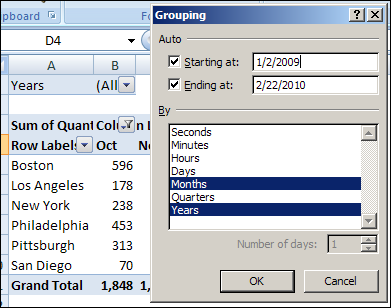
For example, in a pivot table with sales order data, you can group the Order Date field by years and months, to quickly compare the sales totals each month, for a selected year.
In this pivot table example, we have sales data for six stores. Three of the stores are new, and opened in the past 12 months. The other 3 stores are older. You’re doing a presentation to the Board of Directors, and you’d like to compare the sales in the new stores to sales in the older stores.
The new stores are in:
- Los Angeles
- Philadelphia
- San Diego
The older stores are in:
- Boston
- New York
- Pittsburgh
To group the Order Date field, you clicked on one of the dates in the pivot table, then clicked Group Field on the Ribbon’s Option tab.
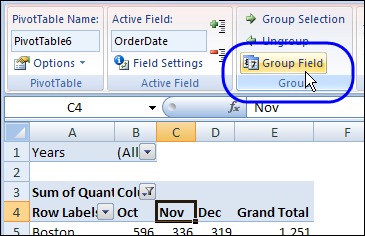
However, when you click a label in the City field, the Group Field command isn’t available, so you aren’t sure how to create the Old and New groups for the City field.
Group the Selected Items
The Group Field command is only available for date and number fields in the Row Labels or Column Labels area of the pivot table.
Because the City names are entered as text, you can use a different method to group them.
- Manually select the cities you want in the first group. To select nonadjacent cities, hold the Ctrl key, and then click the city names.
- In this example, we’ll select the cities with the new stores, Los Angeles, Philadelphia and San Diego.
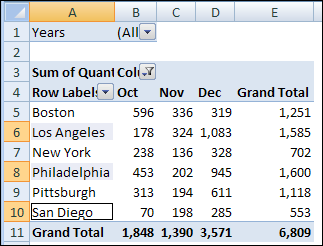
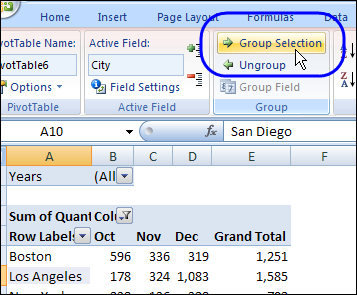
- With the city names selected, on the Ribbon’s Options tab, click Group Selection
Name the Group
This creates a new item in the City field, named Group1, with the selected cities listed under that heading. For each of the remaining cities, a heading is created, with its city name.
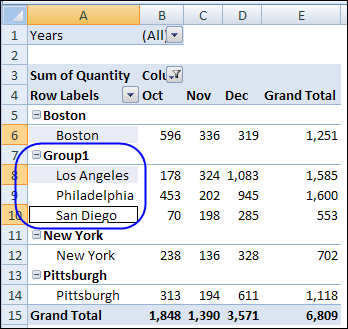
To change the name of the new group, click on the Group1 heading cell, and then type a name for the group, such as New Stores.
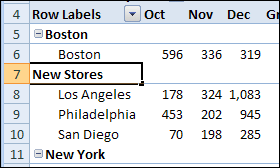
Group the Remaining Items
Next, you can group the remaining stores and name that group.
- Select the remaining stores, and click the Group Selection command to group them.
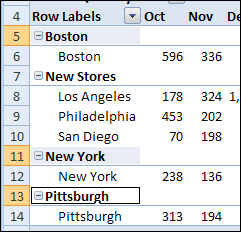
- Name the second group as Old Stores.
Alternative Method of Grouping
Instead of grouping the stores in the pivot table, you could add a StoreType field to the source data, and then enter Old or New for each record.
Next, add the new StoreType field as the first field in the Row Labels area. The city names will appear under the correct StoreType heading.
Videos: Pivot Table Grouping
Learn more about pivot table grouping, and get a workbook with sample file that you can use for testing. Go to the How to Group Pivot Table Data page on my Contextures website.
First, this video shows how to group Text items in a pivot table.
Next, this short video shows the basics of pivot table grouping
______________
For more information on Pivot Tables, please see the Pivot Table Tutorials on the Contextures Website.
______________

Hello,
I often have to group the same departments in a pivot table and this takes quite some time. Is there any way I might save such a grouping and use it for an new pivot table?
thanks very much for your help!
I would like to get the values of my group when it is expanded and/or when it is collapsed. As it stands now, if I group several rows and have the group expanded, I can see only the number values for the rows w/i the group and not for the total, however if I collapse the group then I can see the values only for the group. Is there a way to see them both together at the same time?
thanks,
Rhonda
Is there a way of auto naming the groups? For Example, if I am grouping “model scores” and group 1 ranges from 451 to 531 I would like my group name to be the first and last value ie. “451-531”
Thanks,
Rory