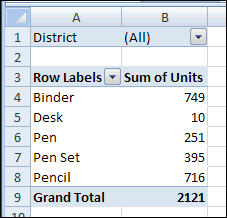
When you add a numeric field to the Values area of a pivot table, it usually appears as a Sum. For example, in the pivot table shown below, the Units field became Sum of Units.

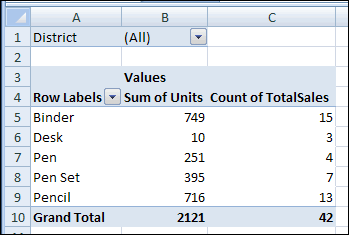
Occasionally, when you add a numeric field to the Values area, it shows the Count, instead of the Sum. In the same pivot table, when the TotalSales field is added, it shows a Count.

Pivot Table Default Function
If you add a number field to the Values area, the default summary function is Sum. However, if the source data has blank cells, or nonnumeric data, such as text or errors, in that field, the Count function is the default summary function.
You can’t change the default settings for the data fields, but you can manually change the summary function after you add the fields to the Values area.
To manually change the summary function:
- Right-click a cell in the field you want to change, and click Summarize Data By.
- Click the summary function that you want to use.

Pivot Table Add-in
There’s a feature that changes all the data fields to SUM, or any other summary function, in my pivot table add-in. It add a new tab to the Ribbon, with time-saving commands that you can use.
- After you install the add-in, select any cell in the pivot table.
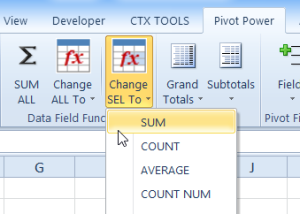
- Then, on the Ribbon’s Pivot Power tab, click SUM ALL.
- Or, click Change ALL to, then click the Summary function that you want to use.
______________
For more information on Pivot Tables, please see the Pivot Table Tutorials on the Contextures Website.
_________________


Can you give me a guide on how to complete this is Excel 2007, it seems the instructions are for 2003 unless I am missing something. I have added the add in but it has made no difference. My issue is that when I create the pivot table when I tick the box to add numerical data it is adding to the row labels and not the values, I am having to then drag from the list to the values and it is seeing the data in count and not sum and then I am having to manually change the field settings for each column which is rather time consuming. Please can you help me and advise my best way forward.
Thanks
Clare
Clare, the instructions are for Excel 2007, so it should match your version.
Are there blank cells in your numerical data column, or text cells in that column? That could make the field default to COUNT, instead of SUM.
No all the numerical field have only figures in apart from the title. Refreshed the data and still will not accept the forecast days in values and wants to add to row labels.
Clare, can you check the pivot table data source? Maybe there’s a blank row that’s accidentally included at the bottom of the range.
very useful! thanks!
do you have any add-in or help on dragging multiple columns (say like 50 or more) into the data field? default is to drag columns one by one and it’s very time consuming.
thanks again.
@min, I’ve just posted a new article on adding the fields from the Pivot Table Field List. It should be faster than dragging the fields into the layout.
Quickly Add Fields in Excel 2003 Pivot Table
Does this add-in work for Excel 2010 as well Debra?
Regards
Akash
great add-in! thx
Thanks! Glad you like the PivotPower add-in.
An excellent add-in. Thanks!
Can you give me a guide on how to complete this is Excel 2010, it seems the instructions are for 2003 unless I am missing something. I have added the add in but it has made no difference. My issue is that when I create the pivot table when I tick the box to add numerical data it is adding to the row labels and not the values, I am having to then drag from the list to the values and it is seeing the data in count and not sum and then I am having to manually change the field settings for each column which is rather time consuming. Please can you help me and advise my best way forward.
Thanks
LOKESHKUMAR A V IFB APL BANGALORE
I was trying to understand how to have the names of the column headings as in the data source,but I failed to find that explanation. What is the problem? Each time you have to choose how the values from data source to be executed the program is adding to the original name the function name: “Sum of…”, “Count of …”, Product of …”. Any attempt to delete the unneccessary preface is giving me an error, that the “PivotTable field name already exists.”
Another point – in blank fields in the raw labels area I recieve the “(blank)” “explanation” text! Why should I need it? In the source excel sheet it is left blank and that is the way to be presented in the PivotTable. It is not allowed to delete it. Again an error is displayed: ” Cannot enter a null value as an item or field name in a PivotTable report”.
For me it seems strange different data or value interpretation in Excel sheet and PivotTable.
That was not the case in the old versions of Excel. My current version is 2010.
All above might have simple solutions, but not intuitive enough. Why should one apply so many editing efforts when trying to use PivotTable to facilitate data presentation if already collected and editted to a certain level in Excel?
Best regards
Rumen
How do you use excel 2010 in order to calculate double summations?
An excellent add-in. Thanks for sharing!