With a running total in a pivot table, you can see how amounts accumulate over a period of time, or through a range of products, as shown in the short video below.
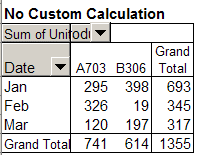
In the video, the pivot table contains monthly sales figures for several products, and we’ll create a running total by month. In the pivot table, Date is in the row area, grouped by month. Product is in the column area, and Units sold, shown as Sum of Units, is in the data area.
This is what the pivot table looks like before we add the Running Totals custom calculation.
Follow these steps to add a Running Total:
- Right-click on one of the data cells, and click on Field Settings.
- Click the Options button.
- From the dropdown list for Show data as, select Running Total In.
- For the Base field, select Date, then click the OK button.
Note: If you select a base field that isn’t in the row or column area, all the results will show an #N/A error.
For more examples of Running Totals, please visit Pivot Tables — Running Totals
___________________________
For more information on pivot tables, see the Pivot Table Topics on my Contextures web site.

